by llandowtuninguk@gmail.com Publish measurement methods for engine preparation and design, from serial logs and oscilloscopes to Crypton analysers and Plex combustion acquisition.
Removed text is struck through; added text is highlighted.
What has to be recorded
Preparing an engine, and designing one, means changing the air path, the fuel, the ignition or injection timing, the compression ratio or the camshaft, then finding out what the running engine did with that change. A serial log from the control unit, a stored oscilloscope trace, a workshop engine analyser and a crank-angle data-acquisition system each keep a different kind of evidence. The useful record is the one that matches the question.
Four questions come up on almost every build. Did the control unit deliver the mixture, timing and boost that were asked for? Did the ignition, the injectors and the crank and cam sensors produce the electrical events that mixture and timing depend on? Are the cylinders sharing the work? And, once those are answered, where in the crankshaft rotation is the pressure rising, how high does it go, and is it ringing?
RecordWhat is storedThe decision it can support
Serial logValues the ECU, or another controller, chooses to transmitMixture, delivered timing, boost, temperatures and limiters, over a pull or a lap
OscilloscopeVoltage or current against time, held in a capture bufferIgnition and injector shape, trigger patterns, charging current, and the physical state of a data bus
Engine analyserA live ignition picture, plus meters for speed, dwell, voltage and often exhaust gasA workshop tune: pattern, balance, timing and the charging system, while the engine is running
Crank-angle acquisitionSensor samples tied to crank position, cycle by cycleCylinder pressure, burn rate, indicated work, knock, and the intake and exhaust pulses
The pages on ignition timing, compression ratio, inlet runners, exhaust tuning and forced induction describe the hardware. This page is the measurement that shows what the hardware did. A brake dynamometer still belongs in the record: it measures shaft torque and speed, and therefore power. It does not say which cylinder produced the torque, at which crank angle the pressure peaked, or whether knock control had already pulled timing out. Those answers come from the logs below.
Serial data logging
For a long time the practical record of a prepared engine was a serial log. The ECU had already sampled its own sensors and calculated its own outputs. A logger asked for those values, or listened to them, and wrote them down against time. The link was serial in the strict sense: the bits travelled one after another on a wire, rather than as a wide parallel sample of the raw voltage.
What the log actually contains
A useful preparation log is built from channels that answer a specific change. Engine speed and throttle, or manifold pressure, place the sample on the operating map. Lambda or air-fuel ratio shows the mixture the engine ran, as distinct from the mixture the table requested. Ignition angle shows the spark the ECU delivered after knock control and any other limiter. Injector pulse width, or a calculated fuel mass, shows the fuel command. Coolant, oil, intake-air and exhaust temperatures show whether the run was thermally comparable with the last one. On a boosted engine the wastegate or vane duty, and the measured boost, show whether the actuator did what the boost table asked. Diagnostic flags matter as much as the smooth channels: a fuel cut, a boost limit or a torque limit can make a pull look like a breathing problem.
Some of those names are measurements and some are models. A channel called load or torque is often the ECU's calculated idea of the operating point, not a transducer. The ME7 logging page is one worked example of separating a request, a limit, a model, a measurement and an output. The same separation applies to any other control unit. A serial log is evidence of what that controller transmitted. It becomes evidence of the engine only for the channels that are real sensor readings, and only at the rate those readings were updated.
A wideband lambda controller often has two outputs of the same reading: an analogue voltage, commonly in a 0–5 V span, and a serial or CAN message. Either can be logged. Logging both, once, is a sound way to prove that the voltage the ECU sees and the digital value the controller claims are the same number.
How the older diagnostic serial link worked
Legislated on-board diagnostics gave the workshop a defined way to ask those questions. On ISO 9141-2 the physical link is a single bidirectional K-line. The line idles high, pulled up in the tester, and either end can pull it low. The published physical specification sets the data rate at 10.4 kbit/s, within 1 percent for the tester. A byte on the wire is a start bit, eight data bits, least significant bit first, and a stop bit. After initialisation the tester sends a request and the ECU sends a response on that same wire. Legislated OBD messages in that specification are short: between 5 and 11 bytes.
Starting the session is slower than the running rate. The public K-line description of the five-baud initialisation has the tester send an address, one bit at a time, for about two seconds. The ECU then answers with a synchronisation byte that establishes 10.4 kbit/s, followed by two key bytes, and the tester acknowledges before normal traffic begins. Keyword Protocol 2000 can skip that five-baud wake-up and use a fast initialisation on the same 10.4 kbit/s line. A 2005 technical paper summarising the legislated protocols gives ISO 9141-2 a maximum message of 11 bytes and KWP 2000, on the same kind of wire, a much longer maximum, around 260 bytes. The longer message can carry more channels in one reply. It does not make the wire any faster.
The bit rate puts a ceiling on the log even before the protocol's mandatory pauses. One 11-byte message is 110 bit-times. At 10.4 kbit/s that is about 10.6 ms. A request and a response of that length occupy about 21 ms of line time, so the wire itself cannot carry 50 such exchanges in a second, and the specified gaps between bytes and messages make a real poll slower still. Ask for more parameter identifiers and each one costs another exchange, unless the protocol packs them into one longer reply. A K-line preparation log of a handful of channels is a stream of numbers at a few tens of samples a second at best, and often slower. That is enough to see the shape of a pull. It is not a picture of one combustion cycle.
The same paper describes legislated CAN diagnostics, ISO 15765-4, as a 500 kbit/s link, with much longer segmented messages. The bus is faster by nearly fifty times. A legislated OBD session on that bus is still a poll: the tester asks, the ECU answers, and the sample interval still grows as the list of identifiers grows. The 500 kbit/s figure is the speed of the bus, not the sample rate of engine speed or lambda. Manufacturer-specific services, including the mode 22 identifiers and UDS services that later loggers request, can expose channels the legislated emissions list never had. They remain a list of values the ECU is willing to send, at the ECU's own update rate.
CAN, and serial links that were built to be logged
A CAN bus is still a serial network. Frames from many controllers share two wires, and a listening logger can record the frames that are already being broadcast without asking for each one. That is a different record from a polled OBD session. An aftermarket ECU is often designed around this. It broadcasts a chosen set of channels, on CAN or on an older RS-232 stream, at a rate its firmware sets. The preparation log can then be denser than a legislated K-line poll. The density is still the broadcast rate. A channel updated at 100 Hz has one sample every 10 ms. At 6,000 rpm a four-stroke cycle takes 20 ms, so that channel has about two samples in the whole cycle and none of the structure inside it.
This is why serial logging became the everyday tool for mixture, timing, temperatures and limiters, and why it stops being the right tool when the question moves inside the cycle. The crankshaft does not appear in a serial log except as a speed number. The ignition event appears as a delivered angle, not as a kilovolt and a burn line. Knock appears, if at all, as a retard or a count the ECU computed from its own knock sensor. Cylinder pressure does not appear at all, unless that ECU was built with in-cylinder transducers, which production car controllers are not.
Using an oscilloscope as a logger
An oscilloscope samples voltage directly, at a rate set for the electrical event rather than for the ECU's broadcast. Used with a current clamp it samples current the same way. Early workshop scopes drew the trace on a cathode-ray tube and the trace was gone when the next one was drawn. A digital storage oscilloscope keeps the samples. That stored capture is a data log: time, voltage, and as many channels as the instrument has, for as long as the memory and the chosen sample rate allow.
Memory, sample rate and a long capture
The limit is arithmetic. The PicoScope 4225A has two channels and the 4425A has four. Both are specified with 250 million samples of buffer memory, shared between the channels that are turned on, and with single-shot rates of 400 MS/s on one channel, 200 MS/s on two, and 100 MS/s on three or four. At 400 MS/s the 250 million samples cover 0.625 seconds. That is the right span for an ignition event or a few crank revolutions at full detail. Slow the sample rate to 1 MS/s and the same memory covers 250 seconds, which is long enough for a road pull or a dyno ramp, at a spacing of 1 µs. The datasheet timebase runs from 5 ns/div to 5,000 s/div, so the same instrument can be set up as a short high-speed capture or as a very slow chart.
Pico's automotive software guide for the 4225 and 4425 describes the practical split. On a fast timebase the scope works in block mode: it fills a buffer, then that waveform is complete. On a slow timebase it changes to streaming mode, in which samples pass continuously to the computer. The guide's control for that change defaults to 200 ms/div and can be set anywhere from 100 ms/div to 500 s/div. The waveform buffer holds successive captures. The guide allows up to 10,000 of them, with a default of 32, and the number that will actually fit depends on the samples in each waveform and on whether the scope is blocking or streaming. The 4225A and 4425A datasheet lists the same outer figures: timebases to 5,000 s/div and a waveform buffer of up to 10,000 waveforms.
Streaming removes the gap that would otherwise fall between block captures, for as long as the computer keeps up. It does not turn the oscilloscope into an unbounded flight recorder. Pico's own CAN case notes make that limit explicit. The scope decodes the frames that are inside the capture it holds. A dedicated CAN logger is the instrument for an uninterrupted record of every frame on a busy bus. The two are complementary. The scope shows the voltage, the edges and the interference. The bus logger keeps the hours of identifiers and payloads.
What is worth capturing on a prepared engine
The channels that change a build are the ones the serial log can only summarise.
Crankshaft and camshaft patterns. A missing-tooth crank wheel and a cam sync are the timing reference for the ECU and, later, for a combustion analyser. The scope shows the pattern, the amplitude and a dropped tooth directly. A serial log can only show the engine speed the ECU managed to calculate from that pattern, or a fault code after it has already given up.
Injector voltage, and current with a clamp. The voltage pulse is the command. The current is the solenoid actually moving. A cylinder that the ECU believes it fuelled, and a cylinder whose injector current never rose, are different faults, and only the second one is visible on the clamp.
Ignition primary, and the secondary through a proper pickup. Dwell, the firing spike and the burn line are the ignition event behind the single "spark advance" number in the log. The 4225A and 4425A inputs are specified to ±250 V peak. Coil secondary voltage is far above that. The secondary is taken with an ignition pickup that reduces it, never with a standard test lead on the coil tower or the plug lead.
Starter current while cranking. Each cylinder that reaches compression loads the starter. Comparing the current peaks compares the cylinders. This relative-compression picture is the same test the workshop analyser called a cranking test. It does not replace a gauge reading in pressure units.
Charging current and alternator ripple. The old engine analyser had a charging and diode test because a weak supply moves sensor references and coil energy. The scope still shows that, as ripple and as current.
The raw sensor behind a serial number. A narrowband lambda sensor switches. A wideband controller's analogue output moves smoothly. A knock sensor is an accelerometer on the block. The serial log contains the ECU's decision. The scope contains the signal the decision was made from.
Triggers are what make the capture a log of an event rather than a film of everything. The 4425A datasheet lists edge, pulse-width, runt, dropout, window and logic triggers, with pre-trigger up to the whole capture length. A dropout trigger can stop the record on a missing crank tooth. Pre-trigger keeps the revolutions that led up to it. The spectrum display, specified from DC to the 20 MHz bandwidth, is the same samples shown against frequency. Pico states that this bandwidth is enough to display CAN and FlexRay. Bandwidth on the ±50 mV range is specified at 10 MHz rather than 20.
PicoScope, in the form used on vehicles
Pico Technology's automotive instruments are the usual modern way to do the capture above, because the inputs and the software are built for vehicle signals rather than for a laboratory bench. The catalogue of kits is on the PicoScope automotive oscilloscopes page. The measurement limits live in the instrument, not in the kit name.
A PicoScope 3000E and PicoScope 7. The screen is the general instrument software: channel controls, a timebase, several traces and a measurement table. The automotive 4225A and 4425A run this software family and add vehicle guided tests, a waveform library and serial decoding. This photograph is a laboratory demonstration board, not a vehicle, and the 3000E does not have the floating automotive inputs. Photograph by Pico Andy, 2024, reduced for display. CC BY 4.0. Source: Wikimedia Commons.A PicoScope 6000, its USB lead, a probe in channel A, and the earlier PicoScope software drawing several traces from one capture. The scope digitises the probe voltages and the computer is the display and the log. This is the laboratory 6000 series, not an automotive 4225A or 4425A. Photograph by Pico Technology, reduced for display. CC BY-SA 4.0. Source: Wikimedia Commons.On a vehicle the same software path is used with floating inputs. The windows that matter for a preparation session are the waveform, the measurements, the buffer, the serial decode and the reference library.How the automotive instrument sits between the engine and the software. Original diagram for this article, drawn from the 4225A and 4425A datasheet and Pico's published decoding notes. It is not a picture of the product.
The 4225A and 4425A datasheet specifies floating single-ended inputs on PicoBNC+ connectors, each with its own reference rather than one ground tied through the oscilloscope to every channel. Input impedance is 1 MΩ in parallel with 24 pF. The full-scale ranges run from ±50 mV to ±200 V. Coupling is AC or DC in software. Vertical resolution is 12 bits, which is 4,096 levels, and the datasheet also lists a 16-bit enhanced-resolution mode. That enhanced mode is processing of the captured samples. DC accuracy is given as ±1 percent of full scale, and ±2 percent on the 50 mV range, inside 15 °C to 30 °C. The instrument is powered from USB 3.0, with USB 2.0 compatibility, and it is specified from 0 °C to 40 °C in operation.
Pico's announcement of the 4425A lists ConnectDetect as a feature carried over from the 4425. The application note for the 4225 and 4425 describes what that indication means. With a ×1 lead and DC coupling, the channel lamp and the software show whether the probe is connected to a low-impedance circuit, which the note puts at up to 100 kΩ. A knock sensor or a lambda sensor can sit above that, so a dark indication is not a failed sensor. The note also says the lamp is not a continuity tester and does not identify an open circuit as distinct from a short.
Serial decoding in the automotive software reads the voltage waveform back into message fields for CAN, CAN FD, FlexRay, LIN and SENT. On a differential bus the practical method Pico describes is a maths channel that subtracts one line from the other, so the decoder sees the difference and rejects interference that is common to both wires. The decoded table and the waveform are the same capture. Clicking a frame marks the bits. This is how a preparation session checks that a CAN lambda message, a pedal message or a torque-reduction message really is on the wire, at the moment the serial log claims it. Pico's case note on identifying CAN nodes is blunt about the sample rate: high-speed CAN wants enough samples per bit, and the software will mark frames when the rate is too low. A one-second window of ordinary traffic in that note contained 1,066 messages. A logger that keeps every message for a session, and a scope that shows the edges of one troublesome second, are doing different jobs.
The kit and the guided tests are a workshop library of known-good shapes. They are not a calibration. A saved waveform from the engine being built, taken at a stated rpm, load and temperature, is the reference the next waveform should be compared with.
Crypton tuners and engine analysers
Before a laptop scope was ordinary workshop equipment, this electrical picture of a running engine was taken on an engine analyser. In Britain the name most often attached to that machine was Crypton. The company history published by Crypton runs from a business called Newton in 1890, through electrical machines in the 1920s, to Crypton Equipment Ltd in 1936, formed by Lancashire Dynamo and Crypto. Later owners include Thorn, then Tube Investments, and a long series of group changes. Crypton's own history lists a management buy-out in 1998, Continental's acquisition of the group in 2012, and Crypton becoming a brand of Aumovio in 2025. Grace's Guide, a secondary historical summary, credits the firm with an early engine tester in 1936 and with oscilloscope testing during the 1950s. The primary descriptions below are contemporary equipment reports, not that summary.
The workshop names were "Crypton tuner" and "engine analyser" for the same class of machine. Said quickly, Crypton is easy to hear as Krypton or as Cern. A Crypton advertisement for the Cypher scanner made the joke itself, setting a Crypton tune against the television programme The Krypton Factor. Those heard names are the same maker.
A Hella engine tester at the Open-air Museum Aschen, 2017. It is not a Crypton. It is the meter-based tune-up set of the same era: voltage, speed, compression, charging current, and selectors for the regulator, alternator, distributor, coil and condenser. Photograph by Spielvogel, reduced for display. CC BY-SA 4.0. Source: Wikimedia Commons.
What a Crypton analyser showed in the ignition years
Commercial Motor described two generations. In October 1957 the Crypton B.70 Master Motor Analyser, from Crypton Equipment of Bridgwater, was a set of portable units: a coil and condenser tester, a tachometer and dwell and voltmeter, an exhaust-gas analyser for petrol and for butane or propane, and an ignition tester with an automatic-advance circuit. A separate Crypton compression tester of that year, the EIX.35, measured cylinder compression and could be adapted to oil pressure. The set is the whole preparation idea of its decade in one trolley. Spark energy, contact dwell, engine speed, timing advance, exhaust gas and a real compression reading were the numbers a tune was judged by.
In November 1971 the Crypton-Triangle BD.125 Motorscope Major was a petrol-engine analyser built around an aluminised cathode-ray tube. The report describes a controlled-amplitude timebase, a primary pattern and a secondary pattern superimposed, and full raster traces, with push-button expansion of the trace. Raster, parade and superimposed displays are the three ways of looking at the same ignition events: every cylinder in a row, every cylinder stacked, or one cylinder enlarged. Dwell was scaled for four, six and eight cylinders. The digitised report gives voltage scales of 0–20 V and 0–2 V, tachometer scales including 0–1,500 rpm and 0–750 rpm, and ohmmeter scales of 1,000, 10,000 and 100,000 ohms. An advance meter was built into the timing light. The controls were an eight-step programme selector, a cylinder selector for two, four, six and eight cylinders, a power-check selector for cylinders 1 to 8, an ohms selector, and push-buttons for voltage, an engine-stop test, two-stroke engines and trace expansion. It ran from 200/250 V at 50/60 Hz. The leads came off a boom, which is why these machines were a bay fixture rather than a hand tool.
The BD.125 Motorscope Major as described by Commercial Motor on 12 November 1971. Original diagram for this article. No photograph of that model was available under a licence that could be published here.
The power-check selector is the cylinder-balance test. On an engine without a computer cutting the injectors, the operator disables one cylinder at a time and watches how far the speed falls. A cylinder whose loss barely moves the speed is a cylinder that was not contributing. Crypton's later workstation description uses those words for the non-computer-controlled case, and a separate cylinder-contribution test where a computer controls the engine. The cranking test on that later description is relative compression from the charging and ignition system while the starter is turning the engine, which is the starter-current comparison a scope still does.
The later workstation
A Crypton dealer's description of the CMT-2010 shows what the analyser had become once ignition was distributorless and the workshop also had to read fault codes. The station is a Windows PC in a wheeled cabinet, with modules added for the job. Fully equipped, that description includes petrol and diesel tests, a visual-inspection list, stored results, a printed sheet, exhaust-emission options for petrol and diesel, a fault-code reader, and a two-channel digital storage oscilloscope in the engine-analyser module. The ignition display covers conventional, distributorless and coil-on-plug systems, primary or secondary, parade, raster and single cylinder, including the power spark and the wasted spark of a double-ended coil. Bar graphs show firing voltage, burn voltage, burn time, dwell and speed. Stored waveform files can be replayed. Battery, starter and alternator tests sit in the same programme.
That is a data log of a sort. The operator can freeze a pattern, save it and print it. It is a log of the ignition and the basic electrical health, organised as a pass-or-fail workshop test. It is not a cycle-by-cycle archive of cylinder pressure, and it is not the ECU's fuel and timing tables. Treating a saved ignition parade as a combustion analysis will send a build in the wrong direction. Treating it as optional, once a serial tool is connected, throws away the only view of the spark and the burn line.
The same workshop role continued on other makers' system testers. The Bosch FSA page covers one later family. Crypton's own published history now places the brand with emissions and garage equipment under VDO and Aumovio. The engine-analyser function is the historical core of the name, and it is still the right name for the job those stations did.
Data-acquisition systems
Data acquisition is the general name for sampling a sensor onto a clock and keeping the samples. The instruments above are already simple cases of it. A serial log acquires whatever the ECU sampled. An oscilloscope acquires voltage on a time clock, very quickly, into a finite memory. A workshop analyser acquires a specialised subset and displays it live. A data-acquisition system for engine design is the same idea with the clock, the sensors and the storage chosen for the experiment.
Three arrangements cover almost all preparation and design work.
Slow, general-purpose acquisition. Temperatures, manifold pressure, fuel pressure, lambda, throttle, speed and similar channels, sampled from a few times a second up to around 100 samples a second. This is the same information as a good serial log, taken from sensors fitted for the test rather than from the ECU. It is how an engine with a carburettor, or a control unit that will not transmit the channel, is still logged. Thermocouple loggers and small CAN loggers sit here.
Bus acquisition. A recorder that keeps every CAN, LIN or other frame for the whole session. This is the uninterrupted serial record. It answers questions about messages, timeouts and what else was on the bus when the engine hesitated.
Crank-angle acquisition. The sample clock is the crankshaft. Pressure, and any other fast sensor, is stored against crank angle for every cycle of every instrumented cylinder. This is indication, in the engine-research sense of the word: the indicated pressure diagram.
A design programme uses them together. The slow channels and the bus log explain the operating point. The crank-angle record explains the combustion at that operating point. A scope is brought out when a trigger, an injector or an ignition waveform is the thing under suspicion. Putting all of those jobs on one instrument usually means doing one of them badly. A 200 kHz pressure channel is wasted on coolant temperature. A 10 Hz coolant channel cannot see knock.
Cylinder pressure on a running engine
Kistler's description of cylinder-pressure measurement is the clean statement of the method. The pressure in the chamber is sampled together with crank angle, or with time, so that each sample belongs to a point in the working cycle. High-pressure indication is the combustion chamber itself. Low-pressure indication is the intake and the exhaust during gas exchange. Both are pressure. They answer different questions, and they need sensors sized for those pressures.
The usual research sensor is piezoelectric. A crystal produces an electrical charge related to the pressure change. Kistler's account of an in-vehicle combustion system lists the chain as the sensor, a cable, a charge amplifier, a crank reference and the recorder. The charge is small, so the cable has to be highly insulating, and it has to be made so that bending it does not generate a false charge by friction inside the insulation. The charge amplifier turns that charge into a voltage the recorder can sample. Because the sensor and amplifier respond to change, the voltage is not a permanent absolute pressure. Somewhere in the cycle the trace has to be tied to a known pressure. That step is called pegging.
An SAE paper on pressure-data quality separates three things that decide whether the diagram can be trusted. The samples must be tied to the real crank position, because anything that needs cylinder volume needs that position. The trace must be pegged to an absolute pressure. And the sensor's own output has to be free of the errors that heat and mounting produce. The paper's result on pegging is specific enough to quote as a finding: an error in the absolute level does not move the calculated mean effective pressure, and it does not move the location of peak pressure, but it does move burn angles and the polytropic coefficients fitted to the compression. Crank-position error is the one that moves the volume, and therefore the work. Thermal shock is a separate sensor error: heat flux into the diaphragm shifts the reading inside a single cycle. Mounting, the passage in front of the sensor, and the sensor's own design all show up there. A tidy average on the screen does not prove the pegging, the top-dead-centre mark or the sensor installation.
Kistler gives three mechanical arrangements. A sensor can be installed through a bore machined in the cylinder head, which is the usual flush research mount. A measuring spark plug carries the sensor and replaces the ordinary plug, so the head is not machined. On a diesel, a glow-plug adapter does the same job. Each arrangement changes the passage between the chamber and the diaphragm, and that passage is part of the measurement.
The work the gas does on the piston is the pressure acting through the change in cylinder volume. Indicated mean effective pressure is that work expressed as an average pressure over the cycle. Peak pressure is the highest point on the trace, and the crank angle of that peak says whether the pressure arrived where the builder expected. Kistler names those two, peak pressure and indicated mean effective pressure, as the primary figures read from the diagram. Heat release, mass fraction burned and the burn angles are calculated from the same diagram and from the slider-crank geometry. They are not extra sensors. A wrong bore, a wrong stroke, a wrong compression height or a wrong top-dead-centre offset moves the calculated burn even when the voltage from the sensor was perfect.
Optical access is a different measurement. Kistler describes optical probes and high-speed imaging as a complement, used to see where knock and pre-ignition start and where soot forms. That is a window and a camera, or a light probe. It is not the same device as a fibre-optic pressure sensor, which measures pressure by a change in light inside a fibre and still produces a pressure number. Both exist. They must not be swapped in a report.
The Plex PCA-2000plus
Plex Tuning, of Koropi in Greece, sells a portable version of this crank-angle system as the PCA-2000plus. Plex dates its combustion-analysis systems from 2012 and describes the plus as a new iteration of the earlier PCA-2000. The March 2025 datasheet and the current product page are the sources for the figures below. Where those two documents disagree, both figures are given.
Plex reported that the PCA-2000plus won the Professional Motorsport World Expo "Data and Electronics Solution of the Year" award for 2023. That is an equipment award reported by the maker. It is not a calibration certificate for a particular sensor or installation.
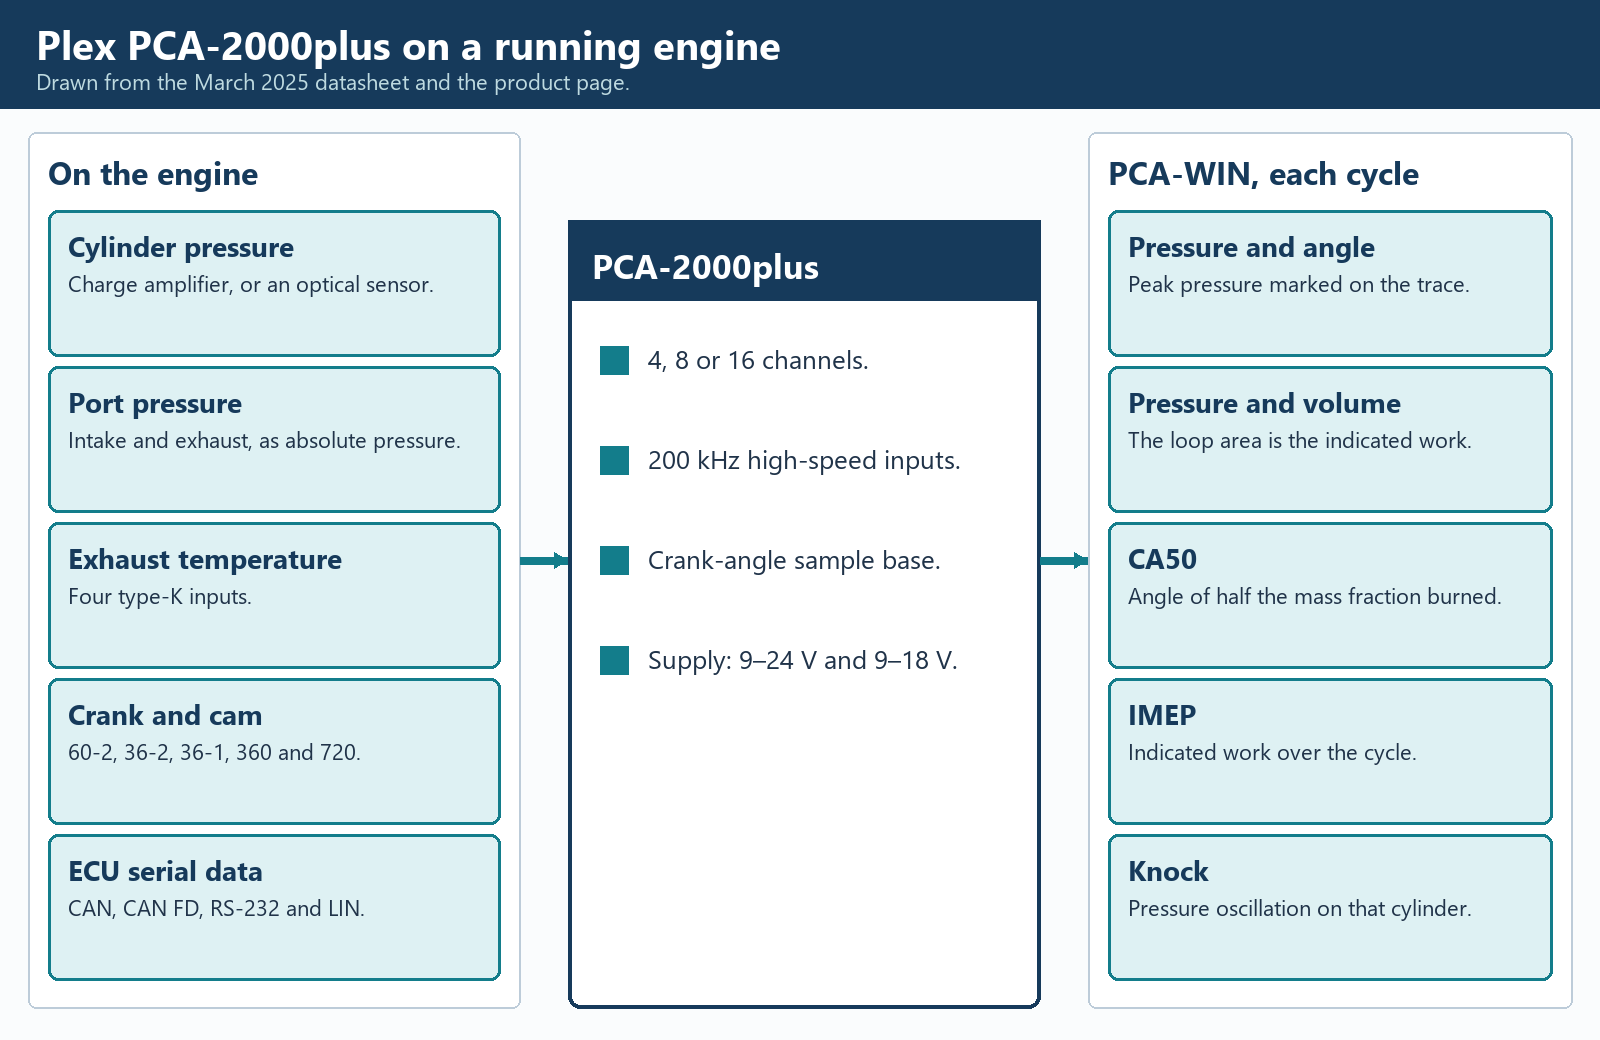
The PCA-2000plus measurement chain. Original diagram for this article, drawn from the March 2025 datasheet and the product page. Plex has not released a product photograph under a licence that could be uploaded here.
The logger itself
The datasheet rates the enclosure at IP67, machined from aluminium, 100 mm by 100 mm by 25 mm or 39 mm depending on the face, and 250 g. Two Souriau motorsport connectors carry the wiring. The published operating-temperature range is −10 °C to +50 °C. That range is for the logger. It is not a rating for an exhaust sensor, and it is a poor match for a unit bolted beside a turbine housing.
Supply voltage is one of the disagreements. The operating-conditions line says 9–24 V DC. The connector notes on the same datasheet describe the power pins as 9–18 V. Until Plex resolves that, the installation limit to treat as binding is the lower one. The datasheet separates the logger's own supply from an auxiliary feed that sources the high-side outputs. The connector notes list the logger supply pin at 0.5 A and the auxiliary feed at 6 A. The two high-side outputs are listed at 3 A each, on or off or as a pulse-width output. The two low-side outputs are listed at 0.5 A in the datasheet and in the connector notes. The specification table on the product page lists those low-side outputs at 3 A. The datasheet pin note is the figure used here.
Sensor power is limited in the connector notes to a regulated 5 V output at 200 mA, shared with a second pin, and an adjustable 3–10 V output at 0.2 A. Those are sensor supplies, not a source for an amplifier that expects a bench PSU. The product page's internal-sensor table mentions a +15 V sensor-supply monitor. The datasheet's connector notes specify the 5 V rail and the 3–10 V adjustable rail. A Kistler or AVL charge amplifier is an external instrument with its own power, which matches Plex's statement that those sensors need external amplifiers.
Fast channels, slow channels and the buses
High-speed analogue inputs are the combustion channels. The unit is sold with 4, 8 or 16 of them. Plex states that the 4-channel and 8-channel versions are upgraded by a firmware purchase, and describes that upgrade as not requiring the logger to be returned for a hardware retrofit. The specified ranges run from ±2.5 V up to ±20 V, and each input can be single-ended or differential. The maximum log rate in both documents is 200 kHz on these channels. At a steady 6,000 rpm, 200 kHz samples spaced evenly in time fall 0.18 crank degrees apart. At 12,000 rpm they fall 0.36 degrees apart. That is arithmetic on the sample rate, not an angle-accuracy claim. The angle grid also depends on the trigger. Plex lists 60-2, 36-2, 36-1, 360 pulses per revolution and 720 pulses per revolution, plus custom patterns on request. A 60-2 wheel has a tooth every 6 degrees, a 36-tooth wheel every 10 degrees, a 360-pulse encoder every degree and a 720-pulse encoder every half degree. Anything finer than the teeth is interpolation inside the logger, and these documents do not state that interpolation step.
Position inputs are specified as two variable-reluctance and two Hall. The configuration software is described as decoding crank and cam patterns, including odd-fire engines, and as accepting valve-timing data, including variable valve timing. A four-stroke diagram is 720 degrees. A crank wheel repeats every 360, so the cam, or another once-per-cycle mark, is what identifies the compression revolution. Entering the valve events tells the software when the filling and the gas exchange are supposed to happen. It is configuration data. It is not, by itself, a measurement of where the valve actually is.
High-speed digital and frequency inputs are listed as 4 or 8. The specification table says 5 V or 16 V. The connector notes say the group is configured for 5 V or 12 V signals. Those inputs are the natural place to timestamp an ignition edge or an injector edge on the same angle base as the pressure, which is how a pressure rise that starts before the spark is distinguished from a rise that follows it.
The slow side is a general-purpose logger in the same box. Four analogue or digital inputs span 0–5 V and four span 0–16 V. Four type-K thermocouple inputs take exhaust or other high temperatures. The product-page table lists 100 Hz as the log rate for this non-high-speed data. Internal sensors add a three-axis accelerometer at ±16 g and 100 Hz, a three-axis gyroscope at 100 Hz, calculated roll, pitch and yaw, a 25 Hz multi-constellation GNSS receiver, a real-time clock and a barometric sensor. Plex describes the barometer as the correction for calculated torque and power as the weather and the altitude change, and the GNSS and inertial sensors as the way to put a combustion figure next to speed, acceleration and place on a road or a track.
Communications are two CAN ports, specified as CAN 2.0 and CAN FD, one RS-232 port, one LIN port, and Ethernet. The datasheet's key-feature list says Gigabit Ethernet. The specification table lists the port as 100 Mbit/s or 1 Gbit/s. Connector notes give CAN 2.0 rates from 250 kbit/s to 1.333 Mbit/s and CAN FD up to 5 Mbit/s, with selectable termination. The product page says the logger can take up to 512 CAN data channels and 512 flag channels, with templates for a range of aftermarket control units and for legislated CAN OBD, manufacturer mode 22, UDS, J1939 and NMEA 2000. A template list is not a promise that a particular calibration variable exists on a particular ECU. It does mean the serial log and the pressure diagram can be the same file.
Storage is 1 GB internal, described as expandable. The product-page table states an option up to 32 GB. The March 2025 datasheet says expandable and does not state the 32 GB option. Sixteen channels at 200 kHz accumulate samples far faster than a 100 Hz CAN log, so a long mapping session is the Ethernet stream to a computer, and the internal memory is the record when the car is out of cable range. Plex also lists a live stream and a fast download of that memory as the purpose of the Ethernet port.
Pressure sensors Plex expects
The datasheet says the logger accepts piezoelectric and optical pressure sensors, including sensors built into a spark plug, and intake and exhaust pressure sensors. AVL and Kistler sensors need external amplifiers. Plex states that it resells Optrand and Kulite sensors, and that AVL and Kistler sensors are bought from those makers.
Plex's description of the optical sensors follows the Optrand fibre-optic type. Pressure changes the light in the fibre. There is no charge to leak away down a dirty connector, and the fibre is immune to the electrical noise of an ignition system. Plex gives high temperature without water cooling as an advantage, with 400 °C as an example rather than as a limit for every probe. The probe's own sheet is the limit. Piezoelectric sensors are described in the same place as the AVL and Kistler pattern: high bandwidth, a charge output, and a compulsory charge amplifier. Plex notes the practical split in accuracy. A thermodynamic calculation wants the better sensor. Peak pressure and knock can be useful on a lesser one. That judgement still depends on the installation. A spark-plug sensor avoids a machined boss in the head, and Plex lists cost, durability and compatibility as the trade. A flush sensor in a purpose-machined bore is the arrangement Kistler describes for research work.
Intake and exhaust sensors on this class of system are often piezoresistive, Kulite being the name Plex resells, because those ports need an absolute or a gauge pressure that stays valid, including vacuum in the manifold and a fast pulse on top of it. A piezoelectric sensor that only follows change is a poor fit for a manifold pressure that sits at 1.5 bar for a whole pull. Assigning a high-speed channel to the intake runner, or to the exhaust primary, is the low-pressure indication Kistler describes. It is also the measurement behind the runner-length and exhaust-primary pages: the pulse is visible, rather than inferred from a torque curve alone.
What the software calculates each cycle
Plex PCA-WIN is the analysis program, with Device Manager as the configuration program. The datasheet lists the calculated set, and the product page defines the terms. They are per cycle and, where more than one cylinder is instrumented, per cylinder.
Peak pressure and its angle. Pmax is the highest pressure in the cycle. Pmax CA is the crank angle at which it occurs. dPmax is the greatest rate of pressure rise, and dPmax CA is where that slope is steepest. Peak pressure is a mechanical load on the piston, the head gasket, the bearings and the fasteners. The rate of rise is how suddenly that load arrives.
Burn angles and combustion duration. Mass fraction burned is the calculated share of the fuel energy released by a given crank angle. CA10, CA50 and CA90 are the angles of 10, 50 and 90 percent burned. CA50 is the midpoint of the burn and the figure Plex points at for ignition, injection and camshaft timing. Combustion duration is the crank-angle span from the start to the end of significant heat release. These are calculations from the pressure and the volume. They move when top dead centre is wrong, and the SAE finding cited above says they also move when pegging is wrong, even though peak-pressure location does not.
Heat release. The heat-release curve is plotted against crank angle, with the maximum and the angle of that maximum. It is derived from the pressure diagram and the changing volume. It is not a heat-flux sensor in the chamber.
Indicated mean effective pressure. Gross IMEP is taken from the compression and expansion strokes. Pumping IMEP is taken from the intake and exhaust strokes. Net IMEP is the work that remains for the piston after gas exchange. Plex describes the related indicated torque and power as the work of the cylinder pressure before friction and inertia. A dynamometer reading is shaft torque, after friction and after the oil pump, the water pump and the alternator. The two numbers are related and they are not interchangeable. The pumping term is where a restrictive exhaust, or a turbine, shows up as work the piston spends pushing gas out, and where a tuned intake shows up as work recovered during induction.
Volumetric efficiency. Plex defines it as the fill of the cylinder against the theoretical maximum, as a percentage. The software can only compute that from the engine size it was given and from the pressures and temperatures it was given. A wrong bore or stroke scales it. It is still the figure that says whether a longer runner, a different cam or a different compressor actually trapped more air.
Knock, pre-ignition and misfire. Knock intensity is the energy Plex calculates in the pressure oscillations. Knock max pressure is the highest positive peak of those oscillations. Pre-ignition is an early burn identified from the pressure, and a misfire is a cycle with no combustion pressure rise. These are three different events. Knock is a ringing burn. Pre-ignition is a burn that started before it should have. A misfire is a burn that did not happen. An ECU knock-retard channel on the serial log is the controller's reaction, often from a block-mounted accelerometer. It can move because the sensor is loose, because the threshold is tight, or because the chamber really rang. The pressure oscillation settles which of those it was.
The displays match the way the numbers are used. A signal-scope view is the raw sensor and trigger voltage, for proving the wiring and the crank pattern before any angle is trusted. A cycle graph plots a channel against crank angle. A pressure-volume graph plots it against cylinder volume, on a linear or a logarithmic axis. The area of that pressure-volume loop is the indicated work. Overlaying many cycles, and averaging them, separates a stable combustion from a lucky single cycle. A statistical view shows minimum, maximum and the scatter of a chosen figure. A binned view groups the cycles into engine-speed bands for a dyno ramp or a track session, which is the form that can be read beside a fuel or ignition table. Plex describes smart tuning maps as cell graphs whose contents can be carried across to the calibration maps. Writing the map is still a change in the ECU's calibration tool, followed by another log.
The datasheet also lists file comparison with a live update, CSV import and export, and video synchronised to the log. Comparison is how a dyno ramp and a lap, or a before and an after, are read as the same kind of picture. Sixteen maths channels are listed. Lap time, acceleration and two trip meters are listed as calculated channels from the GNSS and inertial sensors.
A valvetrain rig is a separate test
An optional firmware and software module analyses valve motion from a SpinTron rig. Plex describes it as able to run with the combustion system or as a valvetrain-only system. The events it names are valve loft, valve toss and valve bounce, and the plots are lift, velocity and acceleration, plus spring harmonics. In camshaft testing, loft and toss are the valve leaving the path the cam was ground to give it, and bounce is the valve leaving the seat again after it has closed. A SpinTron test motors the valvetrain. It does not fire the cylinder. It answers a mechanical question the pressure diagram cannot answer: whether the valve is still following the cam at the speed where the combustion data were taken. A burn angle measured on an engine whose valves are floating is a measurement of a valvetrain failure, and the pressure trace alone will not say so.
Using the records together
A coherent preparation file has three layers, taken on the same run where that is possible.
The serial layer, from the ECU or from the CAN templates in a logger such as the Plex unit, holds the request and the result the controller knows about. Commanded spark against delivered spark, commanded boost against measured boost, lambda against injector time, and any limiter flag. On the Plex logger those channels share a clock with the pressure. On a separate serial tool they have to be aligned afterwards by engine speed and throttle, which is rougher, especially in a gear change.
The electrical layer is the oscilloscope or, in the older bay, the Crypton analyser. It is the proof that the spark, the injector current and the crank pattern exist. A perfect CA50 calculated from a pressure sensor is meaningless if the crank trigger into the analyser is not the same pattern the ECU is using, or if the ignition pickup shows the spark 10 degrees away from the angle the ECU claims to have delivered. The scope capture of that trigger, saved with the combustion file, is the reference.
The combustion layer is the pressure diagram. Per-cylinder peak pressure, CA50, net IMEP and knock intensity, over a repeatable ramp, are the design results. A cylinder that is late, or light on indicated work, or ringing, is then read on its own trace. Intake and exhaust pressure on further high-speed channels show whether that cylinder failed to fill, or spent the work pumping. Exhaust temperature on a type-K input shows a cylinder that is lean or late in a way the single manifold lambda averages out. The barometer and the ambient temperature go in the header of the file so a record made on another day can be compared.
The order of trust runs from the installation upward. Connector and trigger first, on the raw scope view. Then pegging and top dead centre, because they move the burn angles. Then the operating point from the serial channels, because a combustion change at a different lambda or a different coolant temperature is not a test of the part that was changed. Then the cycle statistics, because one clean cycle can be found in a run that is unstable the rest of the time. The binned average is the last picture, and it is the one that can be set beside the calibration table.
Limits
A serial sample rate is the ECU's rate, not the sensor's bandwidth. A modelled load is not a manifold-pressure measurement. An oscilloscope buffer is finite, and a CAN decode inside it is not a day-long bus log. A Crypton parade shows the ignition of its era, and the later workstation adds a short stored scope and a code reader. Neither is cylinder pressure.
On a combustion system, the sensor, the passage, the charge amplifier, the cable, the crank reference and the engine dimensions are all part of the result. Plex's 200 kHz and its list of trigger wheels do not remove thermal shock or a top-dead-centre error. Indicated torque is not brake torque. Knock intensity from chamber pressure is not an ECU knock count. Volumetric efficiency and heat release are calculations. The 4, 8 and 16 channel counts, the current limits, and the supply-voltage figures are only as good as the Plex document they came from, and those documents currently disagree on the points named above. A figure from a sensor or amplifier manual overrides a range printed for the logger input.
Sources
K-line communication description. OBD Clearinghouse. Five-baud initialisation, the two-second address and the move to 10.4 kbit/s. Accessed 2026-11-11.
ISO 9141-2 physical-layer extract. Bidirectional K-line, 10.4 kbit/s, byte format, and OBD messages of 5 to 11 bytes. Accessed 2026-11-11.
Dzhelekarski and Alexiev, diagnostic-protocol summary. Electronics 2005, Technical University of Sofia. ISO 9141-2, KWP 2000 and ISO 15765-4 at 500 kbit/s. Accessed 2026-11-11.
PicoScope 4225A and 4425A datasheet. Pico Technology. Channels, ranges, memory, sample rate, triggers, bandwidth and environment. Accessed 2026-11-11.
PicoScope 6 Automotive introductory guide. Pico Technology. Timebase, waveform buffer, and block versus streaming on the 4225 and 4425. Accessed 2026-11-11.
ConnectDetect. Pico Technology. ×1 leads and the 100 kΩ circuit limit. Accessed 2026-11-11.
Serial decoding. Pico Technology. CAN, CAN FD, FlexRay, LIN and SENT. Accessed 2026-11-11.
CAN bus: who's online, and who said what. Pico Technology. Sample rate, frame counts, and the difference between a scope capture and a CAN logger. Accessed 2026-11-11.
History of Crypton. Crypton / VDO. Company timeline through 2025. Accessed 2026-11-11.
Crypton Equipment. Grace's Guide. Secondary summary, including the 1936 tester and 1950s oscilloscope claims. Accessed 2026-11-11.
Analysing engine performance. Commercial Motor, 25 October 1957. Crypton B.70 Master Motor Analyser and EIX.35 compression tester. Accessed 2026-11-11.
Engine analyser. Commercial Motor, 12 November 1971. Crypton-Triangle BD.125 Motorscope Major. Accessed 2026-11-11.
Crypton CMT-2010 description. Crypton dealer page. Later workstation, ignition scope, balance and cranking tests. Accessed 2026-11-11.
Crypton Cypher scanner page. Crypton dealer page. The Crypton-tune and Krypton Factor wording. Accessed 2026-11-11.
Cylinder pressure measurement. Kistler. High-pressure and low-pressure indication, sensor arrangements, peak pressure and IMEP. Accessed 2026-11-11.
A new data acquisition and processing system for in-vehicle combustion analysis. Kistler, MTZ, 2009. Sensor, cable, charge amplifier, encoder and indicated values. Accessed 2026-11-11.
Cylinder pressure data quality checks and procedures to maximize data accuracy. SAE 2006-01-1346. Crank phasing, pegging and thermal shock. Accessed 2026-11-11.
Plex PCA-2000plus. Plex Tuning. Product description, calculated combustion values, sensors and the specification table. Accessed 2026-11-11.
Plex PCA-2000plus datasheet, March 2025. Plex Tuning. Channels, rates, buses, calculations and the connector limits cited above. Accessed 2026-11-11.
PicoScope 3000E and PicoScope 7. Photograph by Pico Andy, 2024. CC BY 4.0. Reduced for display. Accessed 2026-11-11.
PicoScope 6000 with PicoScope software. Photograph by Pico Technology. CC BY-SA 4.0. Reduced for display. Accessed 2026-11-11.
Hella engine tester. Photograph by Spielvogel, Open-air Museum Aschen, 2017. CC BY-SA 4.0. Reduced for display. Accessed 2026-11-11.K-line communication description. OBD Clearinghouse. Five-baud initialisation, the two-second address and the move to 10.4 kbit/s. Accessed 2026-11-11.
ISO 9141-2 physical-layer extract. Bidirectional K-line, 10.4 kbit/s, byte format, and OBD messages of 5 to 11 bytes. Accessed 2026-11-11.
Dzhelekarski and Alexiev, diagnostic-protocol summary. Electronics 2005, Technical University of Sofia. ISO 9141-2, KWP 2000 and ISO 15765-4 at 500 kbit/s. Accessed 2026-11-11.
PicoScope 4225A and 4425A datasheet. Pico Technology. Channels, ranges, memory, sample rate, triggers, bandwidth and environment. Accessed 2026-11-11.
PicoScope 6 Automotive introductory guide. Pico Technology. Timebase, waveform buffer, and block versus streaming on the 4225 and 4425. Accessed 2026-11-11.
ConnectDetect. Pico Technology. ×1 leads and the 100 kΩ circuit limit. Accessed 2026-11-11.
Serial decoding. Pico Technology. CAN, CAN FD, FlexRay, LIN and SENT. Accessed 2026-11-11.
CAN bus: who's online, and who said what. Pico Technology. Sample rate, frame counts, and the difference between a scope capture and a CAN logger. Accessed 2026-11-11.
History of Crypton. Crypton / VDO. Company timeline through 2025. Accessed 2026-11-11.
Crypton Equipment. Grace's Guide. Secondary summary, including the 1936 tester and 1950s oscilloscope claims. Accessed 2026-11-11.
Analysing engine performance. Commercial Motor, 25 October 1957. Crypton B.70 Master Motor Analyser and EIX.35 compression tester. Accessed 2026-11-11.
Engine analyser. Commercial Motor, 12 November 1971. Crypton-Triangle BD.125 Motorscope Major. Accessed 2026-11-11.
Crypton CMT-2010 description. Crypton dealer page. Later workstation, ignition scope, balance and cranking tests. Accessed 2026-11-11.
Crypton Cypher scanner page. Crypton dealer page. The Crypton-tune and Krypton Factor wording. Accessed 2026-11-11.
Cylinder pressure measurement. Kistler. High-pressure and low-pressure indication, sensor arrangements, peak pressure and IMEP. Accessed 2026-11-11.
A new data acquisition and processing system for in-vehicle combustion analysis. Kistler, MTZ, 2009. Sensor, cable, charge amplifier, encoder and indicated values. Accessed 2026-11-11.
Cylinder pressure data quality checks and procedures to maximize data accuracy. SAE 2006-01-1346. Crank phasing, pegging and thermal shock. Accessed 2026-11-11.
Plex PCA-2000plus. Plex Tuning. Product description, calculated combustion values, sensors and the specification table. Accessed 2026-11-11.
Plex PCA-2000plus datasheet, March 2025. Plex Tuning. Channels, rates, buses, calculations and the connector limits cited above. Accessed 2026-11-11.
Rendered revisions
Open each version to inspect formatting, tables and photographs.
Revision 1: Data logging for engine preparation and design
What has to be recorded
Preparing an engine, and designing one, means changing the air path, the fuel, the ignition or injection timing, the compression ratio or the camshaft, then finding out what the running engine did with that change. A serial log from the control unit, a stored oscilloscope trace, a workshop engine analyser and a crank-angle data-acquisition system each keep a different kind of evidence. The useful record is the one that matches the question.
Four questions come up on almost every build. Did the control unit deliver the mixture, timing and boost that were asked for? Did the ignition, the injectors and the crank and cam sensors produce the electrical events that mixture and timing depend on? Are the cylinders sharing the work? And, once those are answered, where in the crankshaft rotation is the pressure rising, how high does it go, and is it ringing?
Record
What is stored
The decision it can support
Serial log
Values the ECU, or another controller, chooses to transmit
Mixture, delivered timing, boost, temperatures and limiters, over a pull or a lap
Oscilloscope
Voltage or current against time, held in a capture buffer
Ignition and injector shape, trigger patterns, charging current, and the physical state of a data bus
Engine analyser
A live ignition picture, plus meters for speed, dwell, voltage and often exhaust gas
A workshop tune: pattern, balance, timing and the charging system, while the engine is running
Crank-angle acquisition
Sensor samples tied to crank position, cycle by cycle
Cylinder pressure, burn rate, indicated work, knock, and the intake and exhaust pulses
The pages on ignition timing, compression ratio, inlet runners, exhaust tuning and forced induction describe the hardware. This page is the measurement that shows what the hardware did. A brake dynamometer still belongs in the record: it measures shaft torque and speed, and therefore power. It does not say which cylinder produced the torque, at which crank angle the pressure peaked, or whether knock control had already pulled timing out. Those answers come from the logs below.
Serial data logging
For a long time the practical record of a prepared engine was a serial log. The ECU had already sampled its own sensors and calculated its own outputs. A logger asked for those values, or listened to them, and wrote them down against time. The link was serial in the strict sense: the bits travelled one after another on a wire, rather than as a wide parallel sample of the raw voltage.
What the log actually contains
A useful preparation log is built from channels that answer a specific change. Engine speed and throttle, or manifold pressure, place the sample on the operating map. Lambda or air-fuel ratio shows the mixture the engine ran, as distinct from the mixture the table requested. Ignition angle shows the spark the ECU delivered after knock control and any other limiter. Injector pulse width, or a calculated fuel mass, shows the fuel command. Coolant, oil, intake-air and exhaust temperatures show whether the run was thermally comparable with the last one. On a boosted engine the wastegate or vane duty, and the measured boost, show whether the actuator did what the boost table asked. Diagnostic flags matter as much as the smooth channels: a fuel cut, a boost limit or a torque limit can make a pull look like a breathing problem.
Some of those names are measurements and some are models. A channel called load or torque is often the ECU's calculated idea of the operating point, not a transducer. The ME7 logging page is one worked example of separating a request, a limit, a model, a measurement and an output. The same separation applies to any other control unit. A serial log is evidence of what that controller transmitted. It becomes evidence of the engine only for the channels that are real sensor readings, and only at the rate those readings were updated.
A wideband lambda controller often has two outputs of the same reading: an analogue voltage, commonly in a 0–5 V span, and a serial or CAN message. Either can be logged. Logging both, once, is a sound way to prove that the voltage the ECU sees and the digital value the controller claims are the same number.
How the older diagnostic serial link worked
Legislated on-board diagnostics gave the workshop a defined way to ask those questions. On ISO 9141-2 the physical link is a single bidirectional K-line. The line idles high, pulled up in the tester, and either end can pull it low. The published physical specification sets the data rate at 10.4 kbit/s, within 1 percent for the tester. A byte on the wire is a start bit, eight data bits, least significant bit first, and a stop bit. After initialisation the tester sends a request and the ECU sends a response on that same wire. Legislated OBD messages in that specification are short: between 5 and 11 bytes.
Starting the session is slower than the running rate. The public K-line description of the five-baud initialisation has the tester send an address, one bit at a time, for about two seconds. The ECU then answers with a synchronisation byte that establishes 10.4 kbit/s, followed by two key bytes, and the tester acknowledges before normal traffic begins. Keyword Protocol 2000 can skip that five-baud wake-up and use a fast initialisation on the same 10.4 kbit/s line. A 2005 technical paper summarising the legislated protocols gives ISO 9141-2 a maximum message of 11 bytes and KWP 2000, on the same kind of wire, a much longer maximum, around 260 bytes. The longer message can carry more channels in one reply. It does not make the wire any faster.
The bit rate puts a ceiling on the log even before the protocol's mandatory pauses. One 11-byte message is 110 bit-times. At 10.4 kbit/s that is about 10.6 ms. A request and a response of that length occupy about 21 ms of line time, so the wire itself cannot carry 50 such exchanges in a second, and the specified gaps between bytes and messages make a real poll slower still. Ask for more parameter identifiers and each one costs another exchange, unless the protocol packs them into one longer reply. A K-line preparation log of a handful of channels is a stream of numbers at a few tens of samples a second at best, and often slower. That is enough to see the shape of a pull. It is not a picture of one combustion cycle.
The same paper describes legislated CAN diagnostics, ISO 15765-4, as a 500 kbit/s link, with much longer segmented messages. The bus is faster by nearly fifty times. A legislated OBD session on that bus is still a poll: the tester asks, the ECU answers, and the sample interval still grows as the list of identifiers grows. The 500 kbit/s figure is the speed of the bus, not the sample rate of engine speed or lambda. Manufacturer-specific services, including the mode 22 identifiers and UDS services that later loggers request, can expose channels the legislated emissions list never had. They remain a list of values the ECU is willing to send, at the ECU's own update rate.
CAN, and serial links that were built to be logged
A CAN bus is still a serial network. Frames from many controllers share two wires, and a listening logger can record the frames that are already being broadcast without asking for each one. That is a different record from a polled OBD session. An aftermarket ECU is often designed around this. It broadcasts a chosen set of channels, on CAN or on an older RS-232 stream, at a rate its firmware sets. The preparation log can then be denser than a legislated K-line poll. The density is still the broadcast rate. A channel updated at 100 Hz has one sample every 10 ms. At 6,000 rpm a four-stroke cycle takes 20 ms, so that channel has about two samples in the whole cycle and none of the structure inside it.
This is why serial logging became the everyday tool for mixture, timing, temperatures and limiters, and why it stops being the right tool when the question moves inside the cycle. The crankshaft does not appear in a serial log except as a speed number. The ignition event appears as a delivered angle, not as a kilovolt and a burn line. Knock appears, if at all, as a retard or a count the ECU computed from its own knock sensor. Cylinder pressure does not appear at all, unless that ECU was built with in-cylinder transducers, which production car controllers are not.
Using an oscilloscope as a logger
An oscilloscope samples voltage directly, at a rate set for the electrical event rather than for the ECU's broadcast. Used with a current clamp it samples current the same way. Early workshop scopes drew the trace on a cathode-ray tube and the trace was gone when the next one was drawn. A digital storage oscilloscope keeps the samples. That stored capture is a data log: time, voltage, and as many channels as the instrument has, for as long as the memory and the chosen sample rate allow.
Memory, sample rate and a long capture
The limit is arithmetic. The PicoScope 4225A has two channels and the 4425A has four. Both are specified with 250 million samples of buffer memory, shared between the channels that are turned on, and with single-shot rates of 400 MS/s on one channel, 200 MS/s on two, and 100 MS/s on three or four. At 400 MS/s the 250 million samples cover 0.625 seconds. That is the right span for an ignition event or a few crank revolutions at full detail. Slow the sample rate to 1 MS/s and the same memory covers 250 seconds, which is long enough for a road pull or a dyno ramp, at a spacing of 1 µs. The datasheet timebase runs from 5 ns/div to 5,000 s/div, so the same instrument can be set up as a short high-speed capture or as a very slow chart.
Pico's automotive software guide for the 4225 and 4425 describes the practical split. On a fast timebase the scope works in block mode: it fills a buffer, then that waveform is complete. On a slow timebase it changes to streaming mode, in which samples pass continuously to the computer. The guide's control for that change defaults to 200 ms/div and can be set anywhere from 100 ms/div to 500 s/div. The waveform buffer holds successive captures. The guide allows up to 10,000 of them, with a default of 32, and the number that will actually fit depends on the samples in each waveform and on whether the scope is blocking or streaming. The 4225A and 4425A datasheet lists the same outer figures: timebases to 5,000 s/div and a waveform buffer of up to 10,000 waveforms.
Streaming removes the gap that would otherwise fall between block captures, for as long as the computer keeps up. It does not turn the oscilloscope into an unbounded flight recorder. Pico's own CAN case notes make that limit explicit. The scope decodes the frames that are inside the capture it holds. A dedicated CAN logger is the instrument for an uninterrupted record of every frame on a busy bus. The two are complementary. The scope shows the voltage, the edges and the interference. The bus logger keeps the hours of identifiers and payloads.
What is worth capturing on a prepared engine
The channels that change a build are the ones the serial log can only summarise.
Crankshaft and camshaft patterns. A missing-tooth crank wheel and a cam sync are the timing reference for the ECU and, later, for a combustion analyser. The scope shows the pattern, the amplitude and a dropped tooth directly. A serial log can only show the engine speed the ECU managed to calculate from that pattern, or a fault code after it has already given up.
Injector voltage, and current with a clamp. The voltage pulse is the command. The current is the solenoid actually moving. A cylinder that the ECU believes it fuelled, and a cylinder whose injector current never rose, are different faults, and only the second one is visible on the clamp.
Ignition primary, and the secondary through a proper pickup. Dwell, the firing spike and the burn line are the ignition event behind the single "spark advance" number in the log. The 4225A and 4425A inputs are specified to ±250 V peak. Coil secondary voltage is far above that. The secondary is taken with an ignition pickup that reduces it, never with a standard test lead on the coil tower or the plug lead.
Starter current while cranking. Each cylinder that reaches compression loads the starter. Comparing the current peaks compares the cylinders. This relative-compression picture is the same test the workshop analyser called a cranking test. It does not replace a gauge reading in pressure units.
Charging current and alternator ripple. The old engine analyser had a charging and diode test because a weak supply moves sensor references and coil energy. The scope still shows that, as ripple and as current.
The raw sensor behind a serial number. A narrowband lambda sensor switches. A wideband controller's analogue output moves smoothly. A knock sensor is an accelerometer on the block. The serial log contains the ECU's decision. The scope contains the signal the decision was made from.
Triggers are what make the capture a log of an event rather than a film of everything. The 4425A datasheet lists edge, pulse-width, runt, dropout, window and logic triggers, with pre-trigger up to the whole capture length. A dropout trigger can stop the record on a missing crank tooth. Pre-trigger keeps the revolutions that led up to it. The spectrum display, specified from DC to the 20 MHz bandwidth, is the same samples shown against frequency. Pico states that this bandwidth is enough to display CAN and FlexRay. Bandwidth on the ±50 mV range is specified at 10 MHz rather than 20.
PicoScope, in the form used on vehicles
Pico Technology's automotive instruments are the usual modern way to do the capture above, because the inputs and the software are built for vehicle signals rather than for a laboratory bench. The catalogue of kits is on the PicoScope automotive oscilloscopes page. The measurement limits live in the instrument, not in the kit name.
The 4225A and 4425A datasheet specifies floating single-ended inputs on PicoBNC+ connectors, each with its own reference rather than one ground tied through the oscilloscope to every channel. Input impedance is 1 MΩ in parallel with 24 pF. The full-scale ranges run from ±50 mV to ±200 V. Coupling is AC or DC in software. Vertical resolution is 12 bits, which is 4,096 levels, and the datasheet also lists a 16-bit enhanced-resolution mode. That enhanced mode is processing of the captured samples. DC accuracy is given as ±1 percent of full scale, and ±2 percent on the 50 mV range, inside 15 °C to 30 °C. The instrument is powered from USB 3.0, with USB 2.0 compatibility, and it is specified from 0 °C to 40 °C in operation.
Pico's announcement of the 4425A lists ConnectDetect as a feature carried over from the 4425. The application note for the 4225 and 4425 describes what that indication means. With a ×1 lead and DC coupling, the channel lamp and the software show whether the probe is connected to a low-impedance circuit, which the note puts at up to 100 kΩ. A knock sensor or a lambda sensor can sit above that, so a dark indication is not a failed sensor. The note also says the lamp is not a continuity tester and does not identify an open circuit as distinct from a short.
Serial decoding in the automotive software reads the voltage waveform back into message fields for CAN, CAN FD, FlexRay, LIN and SENT. On a differential bus the practical method Pico describes is a maths channel that subtracts one line from the other, so the decoder sees the difference and rejects interference that is common to both wires. The decoded table and the waveform are the same capture. Clicking a frame marks the bits. This is how a preparation session checks that a CAN lambda message, a pedal message or a torque-reduction message really is on the wire, at the moment the serial log claims it. Pico's case note on identifying CAN nodes is blunt about the sample rate: high-speed CAN wants enough samples per bit, and the software will mark frames when the rate is too low. A one-second window of ordinary traffic in that note contained 1,066 messages. A logger that keeps every message for a session, and a scope that shows the edges of one troublesome second, are doing different jobs.
The kit and the guided tests are a workshop library of known-good shapes. They are not a calibration. A saved waveform from the engine being built, taken at a stated rpm, load and temperature, is the reference the next waveform should be compared with.
Crypton tuners and engine analysers
Before a laptop scope was ordinary workshop equipment, this electrical picture of a running engine was taken on an engine analyser. In Britain the name most often attached to that machine was Crypton. The company history published by Crypton runs from a business called Newton in 1890, through electrical machines in the 1920s, to Crypton Equipment Ltd in 1936, formed by Lancashire Dynamo and Crypto. Later owners include Thorn, then Tube Investments, and a long series of group changes. Crypton's own history lists a management buy-out in 1998, Continental's acquisition of the group in 2012, and Crypton becoming a brand of Aumovio in 2025. Grace's Guide, a secondary historical summary, credits the firm with an early engine tester in 1936 and with oscilloscope testing during the 1950s. The primary descriptions below are contemporary equipment reports, not that summary.
The workshop names were "Crypton tuner" and "engine analyser" for the same class of machine. Said quickly, Crypton is easy to hear as Krypton or as Cern. A Crypton advertisement for the Cypher scanner made the joke itself, setting a Crypton tune against the television programme The Krypton Factor. Those heard names are the same maker.
What a Crypton analyser showed in the ignition years
Commercial Motor described two generations. In October 1957 the Crypton B.70 Master Motor Analyser, from Crypton Equipment of Bridgwater, was a set of portable units: a coil and condenser tester, a tachometer and dwell and voltmeter, an exhaust-gas analyser for petrol and for butane or propane, and an ignition tester with an automatic-advance circuit. A separate Crypton compression tester of that year, the EIX.35, measured cylinder compression and could be adapted to oil pressure. The set is the whole preparation idea of its decade in one trolley. Spark energy, contact dwell, engine speed, timing advance, exhaust gas and a real compression reading were the numbers a tune was judged by.
In November 1971 the Crypton-Triangle BD.125 Motorscope Major was a petrol-engine analyser built around an aluminised cathode-ray tube. The report describes a controlled-amplitude timebase, a primary pattern and a secondary pattern superimposed, and full raster traces, with push-button expansion of the trace. Raster, parade and superimposed displays are the three ways of looking at the same ignition events: every cylinder in a row, every cylinder stacked, or one cylinder enlarged. Dwell was scaled for four, six and eight cylinders. The digitised report gives voltage scales of 0–20 V and 0–2 V, tachometer scales including 0–1,500 rpm and 0–750 rpm, and ohmmeter scales of 1,000, 10,000 and 100,000 ohms. An advance meter was built into the timing light. The controls were an eight-step programme selector, a cylinder selector for two, four, six and eight cylinders, a power-check selector for cylinders 1 to 8, an ohms selector, and push-buttons for voltage, an engine-stop test, two-stroke engines and trace expansion. It ran from 200/250 V at 50/60 Hz. The leads came off a boom, which is why these machines were a bay fixture rather than a hand tool.
The power-check selector is the cylinder-balance test. On an engine without a computer cutting the injectors, the operator disables one cylinder at a time and watches how far the speed falls. A cylinder whose loss barely moves the speed is a cylinder that was not contributing. Crypton's later workstation description uses those words for the non-computer-controlled case, and a separate cylinder-contribution test where a computer controls the engine. The cranking test on that later description is relative compression from the charging and ignition system while the starter is turning the engine, which is the starter-current comparison a scope still does.
The later workstation
A Crypton dealer's description of the CMT-2010 shows what the analyser had become once ignition was distributorless and the workshop also had to read fault codes. The station is a Windows PC in a wheeled cabinet, with modules added for the job. Fully equipped, that description includes petrol and diesel tests, a visual-inspection list, stored results, a printed sheet, exhaust-emission options for petrol and diesel, a fault-code reader, and a two-channel digital storage oscilloscope in the engine-analyser module. The ignition display covers conventional, distributorless and coil-on-plug systems, primary or secondary, parade, raster and single cylinder, including the power spark and the wasted spark of a double-ended coil. Bar graphs show firing voltage, burn voltage, burn time, dwell and speed. Stored waveform files can be replayed. Battery, starter and alternator tests sit in the same programme.
That is a data log of a sort. The operator can freeze a pattern, save it and print it. It is a log of the ignition and the basic electrical health, organised as a pass-or-fail workshop test. It is not a cycle-by-cycle archive of cylinder pressure, and it is not the ECU's fuel and timing tables. Treating a saved ignition parade as a combustion analysis will send a build in the wrong direction. Treating it as optional, once a serial tool is connected, throws away the only view of the spark and the burn line.
The same workshop role continued on other makers' system testers. The Bosch FSA page covers one later family. Crypton's own published history now places the brand with emissions and garage equipment under VDO and Aumovio. The engine-analyser function is the historical core of the name, and it is still the right name for the job those stations did.
Data-acquisition systems
Data acquisition is the general name for sampling a sensor onto a clock and keeping the samples. The instruments above are already simple cases of it. A serial log acquires whatever the ECU sampled. An oscilloscope acquires voltage on a time clock, very quickly, into a finite memory. A workshop analyser acquires a specialised subset and displays it live. A data-acquisition system for engine design is the same idea with the clock, the sensors and the storage chosen for the experiment.
Three arrangements cover almost all preparation and design work.
Slow, general-purpose acquisition. Temperatures, manifold pressure, fuel pressure, lambda, throttle, speed and similar channels, sampled from a few times a second up to around 100 samples a second. This is the same information as a good serial log, taken from sensors fitted for the test rather than from the ECU. It is how an engine with a carburettor, or a control unit that will not transmit the channel, is still logged. Thermocouple loggers and small CAN loggers sit here.
Bus acquisition. A recorder that keeps every CAN, LIN or other frame for the whole session. This is the uninterrupted serial record. It answers questions about messages, timeouts and what else was on the bus when the engine hesitated.
Crank-angle acquisition. The sample clock is the crankshaft. Pressure, and any other fast sensor, is stored against crank angle for every cycle of every instrumented cylinder. This is indication, in the engine-research sense of the word: the indicated pressure diagram.
A design programme uses them together. The slow channels and the bus log explain the operating point. The crank-angle record explains the combustion at that operating point. A scope is brought out when a trigger, an injector or an ignition waveform is the thing under suspicion. Putting all of those jobs on one instrument usually means doing one of them badly. A 200 kHz pressure channel is wasted on coolant temperature. A 10 Hz coolant channel cannot see knock.
Cylinder pressure on a running engine
Kistler's description of cylinder-pressure measurement is the clean statement of the method. The pressure in the chamber is sampled together with crank angle, or with time, so that each sample belongs to a point in the working cycle. High-pressure indication is the combustion chamber itself. Low-pressure indication is the intake and the exhaust during gas exchange. Both are pressure. They answer different questions, and they need sensors sized for those pressures.
The usual research sensor is piezoelectric. A crystal produces an electrical charge related to the pressure change. Kistler's account of an in-vehicle combustion system lists the chain as the sensor, a cable, a charge amplifier, a crank reference and the recorder. The charge is small, so the cable has to be highly insulating, and it has to be made so that bending it does not generate a false charge by friction inside the insulation. The charge amplifier turns that charge into a voltage the recorder can sample. Because the sensor and amplifier respond to change, the voltage is not a permanent absolute pressure. Somewhere in the cycle the trace has to be tied to a known pressure. That step is called pegging.
An SAE paper on pressure-data quality separates three things that decide whether the diagram can be trusted. The samples must be tied to the real crank position, because anything that needs cylinder volume needs that position. The trace must be pegged to an absolute pressure. And the sensor's own output has to be free of the errors that heat and mounting produce. The paper's result on pegging is specific enough to quote as a finding: an error in the absolute level does not move the calculated mean effective pressure, and it does not move the location of peak pressure, but it does move burn angles and the polytropic coefficients fitted to the compression. Crank-position error is the one that moves the volume, and therefore the work. Thermal shock is a separate sensor error: heat flux into the diaphragm shifts the reading inside a single cycle. Mounting, the passage in front of the sensor, and the sensor's own design all show up there. A tidy average on the screen does not prove the pegging, the top-dead-centre mark or the sensor installation.
Kistler gives three mechanical arrangements. A sensor can be installed through a bore machined in the cylinder head, which is the usual flush research mount. A measuring spark plug carries the sensor and replaces the ordinary plug, so the head is not machined. On a diesel, a glow-plug adapter does the same job. Each arrangement changes the passage between the chamber and the diaphragm, and that passage is part of the measurement.
The work the gas does on the piston is the pressure acting through the change in cylinder volume. Indicated mean effective pressure is that work expressed as an average pressure over the cycle. Peak pressure is the highest point on the trace, and the crank angle of that peak says whether the pressure arrived where the builder expected. Kistler names those two, peak pressure and indicated mean effective pressure, as the primary figures read from the diagram. Heat release, mass fraction burned and the burn angles are calculated from the same diagram and from the slider-crank geometry. They are not extra sensors. A wrong bore, a wrong stroke, a wrong compression height or a wrong top-dead-centre offset moves the calculated burn even when the voltage from the sensor was perfect.
Optical access is a different measurement. Kistler describes optical probes and high-speed imaging as a complement, used to see where knock and pre-ignition start and where soot forms. That is a window and a camera, or a light probe. It is not the same device as a fibre-optic pressure sensor, which measures pressure by a change in light inside a fibre and still produces a pressure number. Both exist. They must not be swapped in a report.
The Plex PCA-2000plus
Plex Tuning, of Koropi in Greece, sells a portable version of this crank-angle system as the PCA-2000plus. Plex dates its combustion-analysis systems from 2012 and describes the plus as a new iteration of the earlier PCA-2000. The March 2025 datasheet and the current product page are the sources for the figures below. Where those two documents disagree, both figures are given.
Plex reported that the PCA-2000plus won the Professional Motorsport World Expo "Data and Electronics Solution of the Year" award for 2023. That is an equipment award reported by the maker. It is not a calibration certificate for a particular sensor or installation.
The logger itself
The datasheet rates the enclosure at IP67, machined from aluminium, 100 mm by 100 mm by 25 mm or 39 mm depending on the face, and 250 g. Two Souriau motorsport connectors carry the wiring. The published operating-temperature range is −10 °C to +50 °C. That range is for the logger. It is not a rating for an exhaust sensor, and it is a poor match for a unit bolted beside a turbine housing.
Supply voltage is one of the disagreements. The operating-conditions line says 9–24 V DC. The connector notes on the same datasheet describe the power pins as 9–18 V. Until Plex resolves that, the installation limit to treat as binding is the lower one. The datasheet separates the logger's own supply from an auxiliary feed that sources the high-side outputs. The connector notes list the logger supply pin at 0.5 A and the auxiliary feed at 6 A. The two high-side outputs are listed at 3 A each, on or off or as a pulse-width output. The two low-side outputs are listed at 0.5 A in the datasheet and in the connector notes. The specification table on the product page lists those low-side outputs at 3 A. The datasheet pin note is the figure used here.
Sensor power is limited in the connector notes to a regulated 5 V output at 200 mA, shared with a second pin, and an adjustable 3–10 V output at 0.2 A. Those are sensor supplies, not a source for an amplifier that expects a bench PSU. The product page's internal-sensor table mentions a +15 V sensor-supply monitor. The datasheet's connector notes specify the 5 V rail and the 3–10 V adjustable rail. A Kistler or AVL charge amplifier is an external instrument with its own power, which matches Plex's statement that those sensors need external amplifiers.
Fast channels, slow channels and the buses
High-speed analogue inputs are the combustion channels. The unit is sold with 4, 8 or 16 of them. Plex states that the 4-channel and 8-channel versions are upgraded by a firmware purchase, and describes that upgrade as not requiring the logger to be returned for a hardware retrofit. The specified ranges run from ±2.5 V up to ±20 V, and each input can be single-ended or differential. The maximum log rate in both documents is 200 kHz on these channels. At a steady 6,000 rpm, 200 kHz samples spaced evenly in time fall 0.18 crank degrees apart. At 12,000 rpm they fall 0.36 degrees apart. That is arithmetic on the sample rate, not an angle-accuracy claim. The angle grid also depends on the trigger. Plex lists 60-2, 36-2, 36-1, 360 pulses per revolution and 720 pulses per revolution, plus custom patterns on request. A 60-2 wheel has a tooth every 6 degrees, a 36-tooth wheel every 10 degrees, a 360-pulse encoder every degree and a 720-pulse encoder every half degree. Anything finer than the teeth is interpolation inside the logger, and these documents do not state that interpolation step.
Position inputs are specified as two variable-reluctance and two Hall. The configuration software is described as decoding crank and cam patterns, including odd-fire engines, and as accepting valve-timing data, including variable valve timing. A four-stroke diagram is 720 degrees. A crank wheel repeats every 360, so the cam, or another once-per-cycle mark, is what identifies the compression revolution. Entering the valve events tells the software when the filling and the gas exchange are supposed to happen. It is configuration data. It is not, by itself, a measurement of where the valve actually is.
High-speed digital and frequency inputs are listed as 4 or 8. The specification table says 5 V or 16 V. The connector notes say the group is configured for 5 V or 12 V signals. Those inputs are the natural place to timestamp an ignition edge or an injector edge on the same angle base as the pressure, which is how a pressure rise that starts before the spark is distinguished from a rise that follows it.
The slow side is a general-purpose logger in the same box. Four analogue or digital inputs span 0–5 V and four span 0–16 V. Four type-K thermocouple inputs take exhaust or other high temperatures. The product-page table lists 100 Hz as the log rate for this non-high-speed data. Internal sensors add a three-axis accelerometer at ±16 g and 100 Hz, a three-axis gyroscope at 100 Hz, calculated roll, pitch and yaw, a 25 Hz multi-constellation GNSS receiver, a real-time clock and a barometric sensor. Plex describes the barometer as the correction for calculated torque and power as the weather and the altitude change, and the GNSS and inertial sensors as the way to put a combustion figure next to speed, acceleration and place on a road or a track.
Communications are two CAN ports, specified as CAN 2.0 and CAN FD, one RS-232 port, one LIN port, and Ethernet. The datasheet's key-feature list says Gigabit Ethernet. The specification table lists the port as 100 Mbit/s or 1 Gbit/s. Connector notes give CAN 2.0 rates from 250 kbit/s to 1.333 Mbit/s and CAN FD up to 5 Mbit/s, with selectable termination. The product page says the logger can take up to 512 CAN data channels and 512 flag channels, with templates for a range of aftermarket control units and for legislated CAN OBD, manufacturer mode 22, UDS, J1939 and NMEA 2000. A template list is not a promise that a particular calibration variable exists on a particular ECU. It does mean the serial log and the pressure diagram can be the same file.
Storage is 1 GB internal, described as expandable. The product-page table states an option up to 32 GB. The March 2025 datasheet says expandable and does not state the 32 GB option. Sixteen channels at 200 kHz accumulate samples far faster than a 100 Hz CAN log, so a long mapping session is the Ethernet stream to a computer, and the internal memory is the record when the car is out of cable range. Plex also lists a live stream and a fast download of that memory as the purpose of the Ethernet port.
Pressure sensors Plex expects
The datasheet says the logger accepts piezoelectric and optical pressure sensors, including sensors built into a spark plug, and intake and exhaust pressure sensors. AVL and Kistler sensors need external amplifiers. Plex states that it resells Optrand and Kulite sensors, and that AVL and Kistler sensors are bought from those makers.
Plex's description of the optical sensors follows the Optrand fibre-optic type. Pressure changes the light in the fibre. There is no charge to leak away down a dirty connector, and the fibre is immune to the electrical noise of an ignition system. Plex gives high temperature without water cooling as an advantage, with 400 °C as an example rather than as a limit for every probe. The probe's own sheet is the limit. Piezoelectric sensors are described in the same place as the AVL and Kistler pattern: high bandwidth, a charge output, and a compulsory charge amplifier. Plex notes the practical split in accuracy. A thermodynamic calculation wants the better sensor. Peak pressure and knock can be useful on a lesser one. That judgement still depends on the installation. A spark-plug sensor avoids a machined boss in the head, and Plex lists cost, durability and compatibility as the trade. A flush sensor in a purpose-machined bore is the arrangement Kistler describes for research work.
Intake and exhaust sensors on this class of system are often piezoresistive, Kulite being the name Plex resells, because those ports need an absolute or a gauge pressure that stays valid, including vacuum in the manifold and a fast pulse on top of it. A piezoelectric sensor that only follows change is a poor fit for a manifold pressure that sits at 1.5 bar for a whole pull. Assigning a high-speed channel to the intake runner, or to the exhaust primary, is the low-pressure indication Kistler describes. It is also the measurement behind the runner-length and exhaust-primary pages: the pulse is visible, rather than inferred from a torque curve alone.
What the software calculates each cycle
Plex PCA-WIN is the analysis program, with Device Manager as the configuration program. The datasheet lists the calculated set, and the product page defines the terms. They are per cycle and, where more than one cylinder is instrumented, per cylinder.
Peak pressure and its angle. Pmax is the highest pressure in the cycle. Pmax CA is the crank angle at which it occurs. dPmax is the greatest rate of pressure rise, and dPmax CA is where that slope is steepest. Peak pressure is a mechanical load on the piston, the head gasket, the bearings and the fasteners. The rate of rise is how suddenly that load arrives.
Burn angles and combustion duration. Mass fraction burned is the calculated share of the fuel energy released by a given crank angle. CA10, CA50 and CA90 are the angles of 10, 50 and 90 percent burned. CA50 is the midpoint of the burn and the figure Plex points at for ignition, injection and camshaft timing. Combustion duration is the crank-angle span from the start to the end of significant heat release. These are calculations from the pressure and the volume. They move when top dead centre is wrong, and the SAE finding cited above says they also move when pegging is wrong, even though peak-pressure location does not.
Heat release. The heat-release curve is plotted against crank angle, with the maximum and the angle of that maximum. It is derived from the pressure diagram and the changing volume. It is not a heat-flux sensor in the chamber.
Indicated mean effective pressure. Gross IMEP is taken from the compression and expansion strokes. Pumping IMEP is taken from the intake and exhaust strokes. Net IMEP is the work that remains for the piston after gas exchange. Plex describes the related indicated torque and power as the work of the cylinder pressure before friction and inertia. A dynamometer reading is shaft torque, after friction and after the oil pump, the water pump and the alternator. The two numbers are related and they are not interchangeable. The pumping term is where a restrictive exhaust, or a turbine, shows up as work the piston spends pushing gas out, and where a tuned intake shows up as work recovered during induction.
Volumetric efficiency. Plex defines it as the fill of the cylinder against the theoretical maximum, as a percentage. The software can only compute that from the engine size it was given and from the pressures and temperatures it was given. A wrong bore or stroke scales it. It is still the figure that says whether a longer runner, a different cam or a different compressor actually trapped more air.
Knock, pre-ignition and misfire. Knock intensity is the energy Plex calculates in the pressure oscillations. Knock max pressure is the highest positive peak of those oscillations. Pre-ignition is an early burn identified from the pressure, and a misfire is a cycle with no combustion pressure rise. These are three different events. Knock is a ringing burn. Pre-ignition is a burn that started before it should have. A misfire is a burn that did not happen. An ECU knock-retard channel on the serial log is the controller's reaction, often from a block-mounted accelerometer. It can move because the sensor is loose, because the threshold is tight, or because the chamber really rang. The pressure oscillation settles which of those it was.
The displays match the way the numbers are used. A signal-scope view is the raw sensor and trigger voltage, for proving the wiring and the crank pattern before any angle is trusted. A cycle graph plots a channel against crank angle. A pressure-volume graph plots it against cylinder volume, on a linear or a logarithmic axis. The area of that pressure-volume loop is the indicated work. Overlaying many cycles, and averaging them, separates a stable combustion from a lucky single cycle. A statistical view shows minimum, maximum and the scatter of a chosen figure. A binned view groups the cycles into engine-speed bands for a dyno ramp or a track session, which is the form that can be read beside a fuel or ignition table. Plex describes smart tuning maps as cell graphs whose contents can be carried across to the calibration maps. Writing the map is still a change in the ECU's calibration tool, followed by another log.
The datasheet also lists file comparison with a live update, CSV import and export, and video synchronised to the log. Comparison is how a dyno ramp and a lap, or a before and an after, are read as the same kind of picture. Sixteen maths channels are listed. Lap time, acceleration and two trip meters are listed as calculated channels from the GNSS and inertial sensors.
A valvetrain rig is a separate test
An optional firmware and software module analyses valve motion from a SpinTron rig. Plex describes it as able to run with the combustion system or as a valvetrain-only system. The events it names are valve loft, valve toss and valve bounce, and the plots are lift, velocity and acceleration, plus spring harmonics. In camshaft testing, loft and toss are the valve leaving the path the cam was ground to give it, and bounce is the valve leaving the seat again after it has closed. A SpinTron test motors the valvetrain. It does not fire the cylinder. It answers a mechanical question the pressure diagram cannot answer: whether the valve is still following the cam at the speed where the combustion data were taken. A burn angle measured on an engine whose valves are floating is a measurement of a valvetrain failure, and the pressure trace alone will not say so.
Using the records together
A coherent preparation file has three layers, taken on the same run where that is possible.
The serial layer, from the ECU or from the CAN templates in a logger such as the Plex unit, holds the request and the result the controller knows about. Commanded spark against delivered spark, commanded boost against measured boost, lambda against injector time, and any limiter flag. On the Plex logger those channels share a clock with the pressure. On a separate serial tool they have to be aligned afterwards by engine speed and throttle, which is rougher, especially in a gear change.
The electrical layer is the oscilloscope or, in the older bay, the Crypton analyser. It is the proof that the spark, the injector current and the crank pattern exist. A perfect CA50 calculated from a pressure sensor is meaningless if the crank trigger into the analyser is not the same pattern the ECU is using, or if the ignition pickup shows the spark 10 degrees away from the angle the ECU claims to have delivered. The scope capture of that trigger, saved with the combustion file, is the reference.
The combustion layer is the pressure diagram. Per-cylinder peak pressure, CA50, net IMEP and knock intensity, over a repeatable ramp, are the design results. A cylinder that is late, or light on indicated work, or ringing, is then read on its own trace. Intake and exhaust pressure on further high-speed channels show whether that cylinder failed to fill, or spent the work pumping. Exhaust temperature on a type-K input shows a cylinder that is lean or late in a way the single manifold lambda averages out. The barometer and the ambient temperature go in the header of the file so a record made on another day can be compared.
The order of trust runs from the installation upward. Connector and trigger first, on the raw scope view. Then pegging and top dead centre, because they move the burn angles. Then the operating point from the serial channels, because a combustion change at a different lambda or a different coolant temperature is not a test of the part that was changed. Then the cycle statistics, because one clean cycle can be found in a run that is unstable the rest of the time. The binned average is the last picture, and it is the one that can be set beside the calibration table.
Limits
A serial sample rate is the ECU's rate, not the sensor's bandwidth. A modelled load is not a manifold-pressure measurement. An oscilloscope buffer is finite, and a CAN decode inside it is not a day-long bus log. A Crypton parade shows the ignition of its era, and the later workstation adds a short stored scope and a code reader. Neither is cylinder pressure.
On a combustion system, the sensor, the passage, the charge amplifier, the cable, the crank reference and the engine dimensions are all part of the result. Plex's 200 kHz and its list of trigger wheels do not remove thermal shock or a top-dead-centre error. Indicated torque is not brake torque. Knock intensity from chamber pressure is not an ECU knock count. Volumetric efficiency and heat release are calculations. The 4, 8 and 16 channel counts, the current limits, and the supply-voltage figures are only as good as the Plex document they came from, and those documents currently disagree on the points named above. A figure from a sensor or amplifier manual overrides a range printed for the logger input.
Sources
K-line communication description. OBD Clearinghouse. Five-baud initialisation, the two-second address and the move to 10.4 kbit/s. Accessed 2026-11-11.
ISO 9141-2 physical-layer extract. Bidirectional K-line, 10.4 kbit/s, byte format, and OBD messages of 5 to 11 bytes. Accessed 2026-11-11.
ConnectDetect. Pico Technology. ×1 leads and the 100 kΩ circuit limit. Accessed 2026-11-11.
Serial decoding. Pico Technology. CAN, CAN FD, FlexRay, LIN and SENT. Accessed 2026-11-11.
CAN bus: who's online, and who said what. Pico Technology. Sample rate, frame counts, and the difference between a scope capture and a CAN logger. Accessed 2026-11-11.
History of Crypton. Crypton / VDO. Company timeline through 2025. Accessed 2026-11-11.
Crypton Equipment. Grace's Guide. Secondary summary, including the 1936 tester and 1950s oscilloscope claims. Accessed 2026-11-11.
Analysing engine performance. Commercial Motor, 25 October 1957. Crypton B.70 Master Motor Analyser and EIX.35 compression tester. Accessed 2026-11-11.
Revision 6: Data logging for engine preparation and design
What has to be recorded
Preparing an engine, and designing one, means changing the air path, the fuel, the ignition or injection timing, the compression ratio or the camshaft, then finding out what the running engine did with that change. A serial log from the control unit, a stored oscilloscope trace, a workshop engine analyser and a crank-angle data-acquisition system each keep a different kind of evidence. The useful record is the one that matches the question.
Four questions come up on almost every build. Did the control unit deliver the mixture, timing and boost that were asked for? Did the ignition, the injectors and the crank and cam sensors produce the electrical events that mixture and timing depend on? Are the cylinders sharing the work? And, once those are answered, where in the crankshaft rotation is the pressure rising, how high does it go, and is it ringing?
Record
What is stored
The decision it can support
Serial log
Values the ECU, or another controller, chooses to transmit
Mixture, delivered timing, boost, temperatures and limiters, over a pull or a lap
Oscilloscope
Voltage or current against time, held in a capture buffer
Ignition and injector shape, trigger patterns, charging current, and the physical state of a data bus
Engine analyser
A live ignition picture, plus meters for speed, dwell, voltage and often exhaust gas
A workshop tune: pattern, balance, timing and the charging system, while the engine is running
Crank-angle acquisition
Sensor samples tied to crank position, cycle by cycle
Cylinder pressure, burn rate, indicated work, knock, and the intake and exhaust pulses
The pages on ignition timing, compression ratio, inlet runners, exhaust tuning and forced induction describe the hardware. This page is the measurement that shows what the hardware did. A brake dynamometer still belongs in the record: it measures shaft torque and speed, and therefore power. It does not say which cylinder produced the torque, at which crank angle the pressure peaked, or whether knock control had already pulled timing out. Those answers come from the logs below.
Serial data logging
For a long time the practical record of a prepared engine was a serial log. The ECU had already sampled its own sensors and calculated its own outputs. A logger asked for those values, or listened to them, and wrote them down against time. The link was serial in the strict sense: the bits travelled one after another on a wire, rather than as a wide parallel sample of the raw voltage.
What the log actually contains
A useful preparation log is built from channels that answer a specific change. Engine speed and throttle, or manifold pressure, place the sample on the operating map. Lambda or air-fuel ratio shows the mixture the engine ran, as distinct from the mixture the table requested. Ignition angle shows the spark the ECU delivered after knock control and any other limiter. Injector pulse width, or a calculated fuel mass, shows the fuel command. Coolant, oil, intake-air and exhaust temperatures show whether the run was thermally comparable with the last one. On a boosted engine the wastegate or vane duty, and the measured boost, show whether the actuator did what the boost table asked. Diagnostic flags matter as much as the smooth channels: a fuel cut, a boost limit or a torque limit can make a pull look like a breathing problem.
Some of those names are measurements and some are models. A channel called load or torque is often the ECU's calculated idea of the operating point, not a transducer. The ME7 logging page is one worked example of separating a request, a limit, a model, a measurement and an output. The same separation applies to any other control unit. A serial log is evidence of what that controller transmitted. It becomes evidence of the engine only for the channels that are real sensor readings, and only at the rate those readings were updated.
A wideband lambda controller often has two outputs of the same reading: an analogue voltage, commonly in a 0–5 V span, and a serial or CAN message. Either can be logged. Logging both, once, is a sound way to prove that the voltage the ECU sees and the digital value the controller claims are the same number.
How the older diagnostic serial link worked
Legislated on-board diagnostics gave the workshop a defined way to ask those questions. On ISO 9141-2 the physical link is a single bidirectional K-line. The line idles high, pulled up in the tester, and either end can pull it low. The published physical specification sets the data rate at 10.4 kbit/s, within 1 percent for the tester. A byte on the wire is a start bit, eight data bits, least significant bit first, and a stop bit. After initialisation the tester sends a request and the ECU sends a response on that same wire. Legislated OBD messages in that specification are short: between 5 and 11 bytes.
Starting the session is slower than the running rate. The public K-line description of the five-baud initialisation has the tester send an address, one bit at a time, for about two seconds. The ECU then answers with a synchronisation byte that establishes 10.4 kbit/s, followed by two key bytes, and the tester acknowledges before normal traffic begins. Keyword Protocol 2000 can skip that five-baud wake-up and use a fast initialisation on the same 10.4 kbit/s line. A 2005 technical paper summarising the legislated protocols gives ISO 9141-2 a maximum message of 11 bytes and KWP 2000, on the same kind of wire, a much longer maximum, around 260 bytes. The longer message can carry more channels in one reply. It does not make the wire any faster.
The bit rate puts a ceiling on the log even before the protocol's mandatory pauses. One 11-byte message is 110 bit-times. At 10.4 kbit/s that is about 10.6 ms. A request and a response of that length occupy about 21 ms of line time, so the wire itself cannot carry 50 such exchanges in a second, and the specified gaps between bytes and messages make a real poll slower still. Ask for more parameter identifiers and each one costs another exchange, unless the protocol packs them into one longer reply. A K-line preparation log of a handful of channels is a stream of numbers at a few tens of samples a second at best, and often slower. That is enough to see the shape of a pull. It is not a picture of one combustion cycle.
The same paper describes legislated CAN diagnostics, ISO 15765-4, as a 500 kbit/s link, with much longer segmented messages. The bus is faster by nearly fifty times. A legislated OBD session on that bus is still a poll: the tester asks, the ECU answers, and the sample interval still grows as the list of identifiers grows. The 500 kbit/s figure is the speed of the bus, not the sample rate of engine speed or lambda. Manufacturer-specific services, including the mode 22 identifiers and UDS services that later loggers request, can expose channels the legislated emissions list never had. They remain a list of values the ECU is willing to send, at the ECU's own update rate.
CAN, and serial links that were built to be logged
A CAN bus is still a serial network. Frames from many controllers share two wires, and a listening logger can record the frames that are already being broadcast without asking for each one. That is a different record from a polled OBD session. An aftermarket ECU is often designed around this. It broadcasts a chosen set of channels, on CAN or on an older RS-232 stream, at a rate its firmware sets. The preparation log can then be denser than a legislated K-line poll. The density is still the broadcast rate. A channel updated at 100 Hz has one sample every 10 ms. At 6,000 rpm a four-stroke cycle takes 20 ms, so that channel has about two samples in the whole cycle and none of the structure inside it.
This is why serial logging became the everyday tool for mixture, timing, temperatures and limiters, and why it stops being the right tool when the question moves inside the cycle. The crankshaft does not appear in a serial log except as a speed number. The ignition event appears as a delivered angle, not as a kilovolt and a burn line. Knock appears, if at all, as a retard or a count the ECU computed from its own knock sensor. Cylinder pressure does not appear at all, unless that ECU was built with in-cylinder transducers, which production car controllers are not.
Using an oscilloscope as a logger
An oscilloscope samples voltage directly, at a rate set for the electrical event rather than for the ECU's broadcast. Used with a current clamp it samples current the same way. Early workshop scopes drew the trace on a cathode-ray tube and the trace was gone when the next one was drawn. A digital storage oscilloscope keeps the samples. That stored capture is a data log: time, voltage, and as many channels as the instrument has, for as long as the memory and the chosen sample rate allow.
Memory, sample rate and a long capture
The limit is arithmetic. The PicoScope 4225A has two channels and the 4425A has four. Both are specified with 250 million samples of buffer memory, shared between the channels that are turned on, and with single-shot rates of 400 MS/s on one channel, 200 MS/s on two, and 100 MS/s on three or four. At 400 MS/s the 250 million samples cover 0.625 seconds. That is the right span for an ignition event or a few crank revolutions at full detail. Slow the sample rate to 1 MS/s and the same memory covers 250 seconds, which is long enough for a road pull or a dyno ramp, at a spacing of 1 µs. The datasheet timebase runs from 5 ns/div to 5,000 s/div, so the same instrument can be set up as a short high-speed capture or as a very slow chart.
Pico's automotive software guide for the 4225 and 4425 describes the practical split. On a fast timebase the scope works in block mode: it fills a buffer, then that waveform is complete. On a slow timebase it changes to streaming mode, in which samples pass continuously to the computer. The guide's control for that change defaults to 200 ms/div and can be set anywhere from 100 ms/div to 500 s/div. The waveform buffer holds successive captures. The guide allows up to 10,000 of them, with a default of 32, and the number that will actually fit depends on the samples in each waveform and on whether the scope is blocking or streaming. The 4225A and 4425A datasheet lists the same outer figures: timebases to 5,000 s/div and a waveform buffer of up to 10,000 waveforms.
Streaming removes the gap that would otherwise fall between block captures, for as long as the computer keeps up. It does not turn the oscilloscope into an unbounded flight recorder. Pico's own CAN case notes make that limit explicit. The scope decodes the frames that are inside the capture it holds. A dedicated CAN logger is the instrument for an uninterrupted record of every frame on a busy bus. The two are complementary. The scope shows the voltage, the edges and the interference. The bus logger keeps the hours of identifiers and payloads.
What is worth capturing on a prepared engine
The channels that change a build are the ones the serial log can only summarise.
Crankshaft and camshaft patterns. A missing-tooth crank wheel and a cam sync are the timing reference for the ECU and, later, for a combustion analyser. The scope shows the pattern, the amplitude and a dropped tooth directly. A serial log can only show the engine speed the ECU managed to calculate from that pattern, or a fault code after it has already given up.
Injector voltage, and current with a clamp. The voltage pulse is the command. The current is the solenoid actually moving. A cylinder that the ECU believes it fuelled, and a cylinder whose injector current never rose, are different faults, and only the second one is visible on the clamp.
Ignition primary, and the secondary through a proper pickup. Dwell, the firing spike and the burn line are the ignition event behind the single "spark advance" number in the log. The 4225A and 4425A inputs are specified to ±250 V peak. Coil secondary voltage is far above that. The secondary is taken with an ignition pickup that reduces it, never with a standard test lead on the coil tower or the plug lead.
Starter current while cranking. Each cylinder that reaches compression loads the starter. Comparing the current peaks compares the cylinders. This relative-compression picture is the same test the workshop analyser called a cranking test. It does not replace a gauge reading in pressure units.
Charging current and alternator ripple. The old engine analyser had a charging and diode test because a weak supply moves sensor references and coil energy. The scope still shows that, as ripple and as current.
The raw sensor behind a serial number. A narrowband lambda sensor switches. A wideband controller's analogue output moves smoothly. A knock sensor is an accelerometer on the block. The serial log contains the ECU's decision. The scope contains the signal the decision was made from.
Triggers are what make the capture a log of an event rather than a film of everything. The 4425A datasheet lists edge, pulse-width, runt, dropout, window and logic triggers, with pre-trigger up to the whole capture length. A dropout trigger can stop the record on a missing crank tooth. Pre-trigger keeps the revolutions that led up to it. The spectrum display, specified from DC to the 20 MHz bandwidth, is the same samples shown against frequency. Pico states that this bandwidth is enough to display CAN and FlexRay. Bandwidth on the ±50 mV range is specified at 10 MHz rather than 20.
PicoScope, in the form used on vehicles
Pico Technology's automotive instruments are the usual modern way to do the capture above, because the inputs and the software are built for vehicle signals rather than for a laboratory bench. The catalogue of kits is on the PicoScope automotive oscilloscopes page. The measurement limits live in the instrument, not in the kit name.
A PicoScope 3000E and PicoScope 7. The screen is the general instrument software: channel controls, a timebase, several traces and a measurement table. The automotive 4225A and 4425A run this software family and add vehicle guided tests, a waveform library and serial decoding. This photograph is a laboratory demonstration board, not a vehicle, and the 3000E does not have the floating automotive inputs. Photograph by Pico Andy, 2024, reduced for display. CC BY 4.0. Source: Wikimedia Commons.A PicoScope 6000, its USB lead, a probe in channel A, and the earlier PicoScope software drawing several traces from one capture. The scope digitises the probe voltages and the computer is the display and the log. This is the laboratory 6000 series, not an automotive 4225A or 4425A. Photograph by Pico Technology, reduced for display. CC BY-SA 4.0. Source: Wikimedia Commons.
On a vehicle the same software path is used with floating inputs. The windows that matter for a preparation session are the waveform, the measurements, the buffer, the serial decode and the reference library.
How the automotive instrument sits between the engine and the software. Original diagram for this article, drawn from the 4225A and 4425A datasheet and Pico's published decoding notes. It is not a picture of the product.
The 4225A and 4425A datasheet specifies floating single-ended inputs on PicoBNC+ connectors, each with its own reference rather than one ground tied through the oscilloscope to every channel. Input impedance is 1 MΩ in parallel with 24 pF. The full-scale ranges run from ±50 mV to ±200 V. Coupling is AC or DC in software. Vertical resolution is 12 bits, which is 4,096 levels, and the datasheet also lists a 16-bit enhanced-resolution mode. That enhanced mode is processing of the captured samples. DC accuracy is given as ±1 percent of full scale, and ±2 percent on the 50 mV range, inside 15 °C to 30 °C. The instrument is powered from USB 3.0, with USB 2.0 compatibility, and it is specified from 0 °C to 40 °C in operation.
Pico's announcement of the 4425A lists ConnectDetect as a feature carried over from the 4425. The application note for the 4225 and 4425 describes what that indication means. With a ×1 lead and DC coupling, the channel lamp and the software show whether the probe is connected to a low-impedance circuit, which the note puts at up to 100 kΩ. A knock sensor or a lambda sensor can sit above that, so a dark indication is not a failed sensor. The note also says the lamp is not a continuity tester and does not identify an open circuit as distinct from a short.
Serial decoding in the automotive software reads the voltage waveform back into message fields for CAN, CAN FD, FlexRay, LIN and SENT. On a differential bus the practical method Pico describes is a maths channel that subtracts one line from the other, so the decoder sees the difference and rejects interference that is common to both wires. The decoded table and the waveform are the same capture. Clicking a frame marks the bits. This is how a preparation session checks that a CAN lambda message, a pedal message or a torque-reduction message really is on the wire, at the moment the serial log claims it. Pico's case note on identifying CAN nodes is blunt about the sample rate: high-speed CAN wants enough samples per bit, and the software will mark frames when the rate is too low. A one-second window of ordinary traffic in that note contained 1,066 messages. A logger that keeps every message for a session, and a scope that shows the edges of one troublesome second, are doing different jobs.
The kit and the guided tests are a workshop library of known-good shapes. They are not a calibration. A saved waveform from the engine being built, taken at a stated rpm, load and temperature, is the reference the next waveform should be compared with.
Crypton tuners and engine analysers
Before a laptop scope was ordinary workshop equipment, this electrical picture of a running engine was taken on an engine analyser. In Britain the name most often attached to that machine was Crypton. The company history published by Crypton runs from a business called Newton in 1890, through electrical machines in the 1920s, to Crypton Equipment Ltd in 1936, formed by Lancashire Dynamo and Crypto. Later owners include Thorn, then Tube Investments, and a long series of group changes. Crypton's own history lists a management buy-out in 1998, Continental's acquisition of the group in 2012, and Crypton becoming a brand of Aumovio in 2025. Grace's Guide, a secondary historical summary, credits the firm with an early engine tester in 1936 and with oscilloscope testing during the 1950s. The primary descriptions below are contemporary equipment reports, not that summary.
The workshop names were "Crypton tuner" and "engine analyser" for the same class of machine. Said quickly, Crypton is easy to hear as Krypton or as Cern. A Crypton advertisement for the Cypher scanner made the joke itself, setting a Crypton tune against the television programme The Krypton Factor. Those heard names are the same maker.
A Hella engine tester at the Open-air Museum Aschen, 2017. It is not a Crypton. It is the meter-based tune-up set of the same era: voltage, speed, compression, charging current, and selectors for the regulator, alternator, distributor, coil and condenser. Photograph by Spielvogel, reduced for display. CC BY-SA 4.0. Source: Wikimedia Commons.
What a Crypton analyser showed in the ignition years
Commercial Motor described two generations. In October 1957 the Crypton B.70 Master Motor Analyser, from Crypton Equipment of Bridgwater, was a set of portable units: a coil and condenser tester, a tachometer and dwell and voltmeter, an exhaust-gas analyser for petrol and for butane or propane, and an ignition tester with an automatic-advance circuit. A separate Crypton compression tester of that year, the EIX.35, measured cylinder compression and could be adapted to oil pressure. The set is the whole preparation idea of its decade in one trolley. Spark energy, contact dwell, engine speed, timing advance, exhaust gas and a real compression reading were the numbers a tune was judged by.
In November 1971 the Crypton-Triangle BD.125 Motorscope Major was a petrol-engine analyser built around an aluminised cathode-ray tube. The report describes a controlled-amplitude timebase, a primary pattern and a secondary pattern superimposed, and full raster traces, with push-button expansion of the trace. Raster, parade and superimposed displays are the three ways of looking at the same ignition events: every cylinder in a row, every cylinder stacked, or one cylinder enlarged. Dwell was scaled for four, six and eight cylinders. The digitised report gives voltage scales of 0–20 V and 0–2 V, tachometer scales including 0–1,500 rpm and 0–750 rpm, and ohmmeter scales of 1,000, 10,000 and 100,000 ohms. An advance meter was built into the timing light. The controls were an eight-step programme selector, a cylinder selector for two, four, six and eight cylinders, a power-check selector for cylinders 1 to 8, an ohms selector, and push-buttons for voltage, an engine-stop test, two-stroke engines and trace expansion. It ran from 200/250 V at 50/60 Hz. The leads came off a boom, which is why these machines were a bay fixture rather than a hand tool.
The BD.125 Motorscope Major as described by Commercial Motor on 12 November 1971. Original diagram for this article. No photograph of that model was available under a licence that could be published here.
The power-check selector is the cylinder-balance test. On an engine without a computer cutting the injectors, the operator disables one cylinder at a time and watches how far the speed falls. A cylinder whose loss barely moves the speed is a cylinder that was not contributing. Crypton's later workstation description uses those words for the non-computer-controlled case, and a separate cylinder-contribution test where a computer controls the engine. The cranking test on that later description is relative compression from the charging and ignition system while the starter is turning the engine, which is the starter-current comparison a scope still does.
The later workstation
A Crypton dealer's description of the CMT-2010 shows what the analyser had become once ignition was distributorless and the workshop also had to read fault codes. The station is a Windows PC in a wheeled cabinet, with modules added for the job. Fully equipped, that description includes petrol and diesel tests, a visual-inspection list, stored results, a printed sheet, exhaust-emission options for petrol and diesel, a fault-code reader, and a two-channel digital storage oscilloscope in the engine-analyser module. The ignition display covers conventional, distributorless and coil-on-plug systems, primary or secondary, parade, raster and single cylinder, including the power spark and the wasted spark of a double-ended coil. Bar graphs show firing voltage, burn voltage, burn time, dwell and speed. Stored waveform files can be replayed. Battery, starter and alternator tests sit in the same programme.
That is a data log of a sort. The operator can freeze a pattern, save it and print it. It is a log of the ignition and the basic electrical health, organised as a pass-or-fail workshop test. It is not a cycle-by-cycle archive of cylinder pressure, and it is not the ECU's fuel and timing tables. Treating a saved ignition parade as a combustion analysis will send a build in the wrong direction. Treating it as optional, once a serial tool is connected, throws away the only view of the spark and the burn line.
The same workshop role continued on other makers' system testers. The Bosch FSA page covers one later family. Crypton's own published history now places the brand with emissions and garage equipment under VDO and Aumovio. The engine-analyser function is the historical core of the name, and it is still the right name for the job those stations did.
Data-acquisition systems
Data acquisition is the general name for sampling a sensor onto a clock and keeping the samples. The instruments above are already simple cases of it. A serial log acquires whatever the ECU sampled. An oscilloscope acquires voltage on a time clock, very quickly, into a finite memory. A workshop analyser acquires a specialised subset and displays it live. A data-acquisition system for engine design is the same idea with the clock, the sensors and the storage chosen for the experiment.
Three arrangements cover almost all preparation and design work.
Slow, general-purpose acquisition. Temperatures, manifold pressure, fuel pressure, lambda, throttle, speed and similar channels, sampled from a few times a second up to around 100 samples a second. This is the same information as a good serial log, taken from sensors fitted for the test rather than from the ECU. It is how an engine with a carburettor, or a control unit that will not transmit the channel, is still logged. Thermocouple loggers and small CAN loggers sit here.
Bus acquisition. A recorder that keeps every CAN, LIN or other frame for the whole session. This is the uninterrupted serial record. It answers questions about messages, timeouts and what else was on the bus when the engine hesitated.
Crank-angle acquisition. The sample clock is the crankshaft. Pressure, and any other fast sensor, is stored against crank angle for every cycle of every instrumented cylinder. This is indication, in the engine-research sense of the word: the indicated pressure diagram.
A design programme uses them together. The slow channels and the bus log explain the operating point. The crank-angle record explains the combustion at that operating point. A scope is brought out when a trigger, an injector or an ignition waveform is the thing under suspicion. Putting all of those jobs on one instrument usually means doing one of them badly. A 200 kHz pressure channel is wasted on coolant temperature. A 10 Hz coolant channel cannot see knock.
Cylinder pressure on a running engine
Kistler's description of cylinder-pressure measurement is the clean statement of the method. The pressure in the chamber is sampled together with crank angle, or with time, so that each sample belongs to a point in the working cycle. High-pressure indication is the combustion chamber itself. Low-pressure indication is the intake and the exhaust during gas exchange. Both are pressure. They answer different questions, and they need sensors sized for those pressures.
The usual research sensor is piezoelectric. A crystal produces an electrical charge related to the pressure change. Kistler's account of an in-vehicle combustion system lists the chain as the sensor, a cable, a charge amplifier, a crank reference and the recorder. The charge is small, so the cable has to be highly insulating, and it has to be made so that bending it does not generate a false charge by friction inside the insulation. The charge amplifier turns that charge into a voltage the recorder can sample. Because the sensor and amplifier respond to change, the voltage is not a permanent absolute pressure. Somewhere in the cycle the trace has to be tied to a known pressure. That step is called pegging.
An SAE paper on pressure-data quality separates three things that decide whether the diagram can be trusted. The samples must be tied to the real crank position, because anything that needs cylinder volume needs that position. The trace must be pegged to an absolute pressure. And the sensor's own output has to be free of the errors that heat and mounting produce. The paper's result on pegging is specific enough to quote as a finding: an error in the absolute level does not move the calculated mean effective pressure, and it does not move the location of peak pressure, but it does move burn angles and the polytropic coefficients fitted to the compression. Crank-position error is the one that moves the volume, and therefore the work. Thermal shock is a separate sensor error: heat flux into the diaphragm shifts the reading inside a single cycle. Mounting, the passage in front of the sensor, and the sensor's own design all show up there. A tidy average on the screen does not prove the pegging, the top-dead-centre mark or the sensor installation.
Kistler gives three mechanical arrangements. A sensor can be installed through a bore machined in the cylinder head, which is the usual flush research mount. A measuring spark plug carries the sensor and replaces the ordinary plug, so the head is not machined. On a diesel, a glow-plug adapter does the same job. Each arrangement changes the passage between the chamber and the diaphragm, and that passage is part of the measurement.
The work the gas does on the piston is the pressure acting through the change in cylinder volume. Indicated mean effective pressure is that work expressed as an average pressure over the cycle. Peak pressure is the highest point on the trace, and the crank angle of that peak says whether the pressure arrived where the builder expected. Kistler names those two, peak pressure and indicated mean effective pressure, as the primary figures read from the diagram. Heat release, mass fraction burned and the burn angles are calculated from the same diagram and from the slider-crank geometry. They are not extra sensors. A wrong bore, a wrong stroke, a wrong compression height or a wrong top-dead-centre offset moves the calculated burn even when the voltage from the sensor was perfect.
Optical access is a different measurement. Kistler describes optical probes and high-speed imaging as a complement, used to see where knock and pre-ignition start and where soot forms. That is a window and a camera, or a light probe. It is not the same device as a fibre-optic pressure sensor, which measures pressure by a change in light inside a fibre and still produces a pressure number. Both exist. They must not be swapped in a report.
The Plex PCA-2000plus
Plex Tuning, of Koropi in Greece, sells a portable version of this crank-angle system as the PCA-2000plus. Plex dates its combustion-analysis systems from 2012 and describes the plus as a new iteration of the earlier PCA-2000. The March 2025 datasheet and the current product page are the sources for the figures below. Where those two documents disagree, both figures are given.
Plex reported that the PCA-2000plus won the Professional Motorsport World Expo "Data and Electronics Solution of the Year" award for 2023. That is an equipment award reported by the maker. It is not a calibration certificate for a particular sensor or installation.
The PCA-2000plus measurement chain. Original diagram for this article, drawn from the March 2025 datasheet and the product page. Plex has not released a product photograph under a licence that could be uploaded here.
The logger itself
The datasheet rates the enclosure at IP67, machined from aluminium, 100 mm by 100 mm by 25 mm or 39 mm depending on the face, and 250 g. Two Souriau motorsport connectors carry the wiring. The published operating-temperature range is −10 °C to +50 °C. That range is for the logger. It is not a rating for an exhaust sensor, and it is a poor match for a unit bolted beside a turbine housing.
Supply voltage is one of the disagreements. The operating-conditions line says 9–24 V DC. The connector notes on the same datasheet describe the power pins as 9–18 V. Until Plex resolves that, the installation limit to treat as binding is the lower one. The datasheet separates the logger's own supply from an auxiliary feed that sources the high-side outputs. The connector notes list the logger supply pin at 0.5 A and the auxiliary feed at 6 A. The two high-side outputs are listed at 3 A each, on or off or as a pulse-width output. The two low-side outputs are listed at 0.5 A in the datasheet and in the connector notes. The specification table on the product page lists those low-side outputs at 3 A. The datasheet pin note is the figure used here.
Sensor power is limited in the connector notes to a regulated 5 V output at 200 mA, shared with a second pin, and an adjustable 3–10 V output at 0.2 A. Those are sensor supplies, not a source for an amplifier that expects a bench PSU. The product page's internal-sensor table mentions a +15 V sensor-supply monitor. The datasheet's connector notes specify the 5 V rail and the 3–10 V adjustable rail. A Kistler or AVL charge amplifier is an external instrument with its own power, which matches Plex's statement that those sensors need external amplifiers.
Fast channels, slow channels and the buses
High-speed analogue inputs are the combustion channels. The unit is sold with 4, 8 or 16 of them. Plex states that the 4-channel and 8-channel versions are upgraded by a firmware purchase, and describes that upgrade as not requiring the logger to be returned for a hardware retrofit. The specified ranges run from ±2.5 V up to ±20 V, and each input can be single-ended or differential. The maximum log rate in both documents is 200 kHz on these channels. At a steady 6,000 rpm, 200 kHz samples spaced evenly in time fall 0.18 crank degrees apart. At 12,000 rpm they fall 0.36 degrees apart. That is arithmetic on the sample rate, not an angle-accuracy claim. The angle grid also depends on the trigger. Plex lists 60-2, 36-2, 36-1, 360 pulses per revolution and 720 pulses per revolution, plus custom patterns on request. A 60-2 wheel has a tooth every 6 degrees, a 36-tooth wheel every 10 degrees, a 360-pulse encoder every degree and a 720-pulse encoder every half degree. Anything finer than the teeth is interpolation inside the logger, and these documents do not state that interpolation step.
Position inputs are specified as two variable-reluctance and two Hall. The configuration software is described as decoding crank and cam patterns, including odd-fire engines, and as accepting valve-timing data, including variable valve timing. A four-stroke diagram is 720 degrees. A crank wheel repeats every 360, so the cam, or another once-per-cycle mark, is what identifies the compression revolution. Entering the valve events tells the software when the filling and the gas exchange are supposed to happen. It is configuration data. It is not, by itself, a measurement of where the valve actually is.
High-speed digital and frequency inputs are listed as 4 or 8. The specification table says 5 V or 16 V. The connector notes say the group is configured for 5 V or 12 V signals. Those inputs are the natural place to timestamp an ignition edge or an injector edge on the same angle base as the pressure, which is how a pressure rise that starts before the spark is distinguished from a rise that follows it.
The slow side is a general-purpose logger in the same box. Four analogue or digital inputs span 0–5 V and four span 0–16 V. Four type-K thermocouple inputs take exhaust or other high temperatures. The product-page table lists 100 Hz as the log rate for this non-high-speed data. Internal sensors add a three-axis accelerometer at ±16 g and 100 Hz, a three-axis gyroscope at 100 Hz, calculated roll, pitch and yaw, a 25 Hz multi-constellation GNSS receiver, a real-time clock and a barometric sensor. Plex describes the barometer as the correction for calculated torque and power as the weather and the altitude change, and the GNSS and inertial sensors as the way to put a combustion figure next to speed, acceleration and place on a road or a track.
Communications are two CAN ports, specified as CAN 2.0 and CAN FD, one RS-232 port, one LIN port, and Ethernet. The datasheet's key-feature list says Gigabit Ethernet. The specification table lists the port as 100 Mbit/s or 1 Gbit/s. Connector notes give CAN 2.0 rates from 250 kbit/s to 1.333 Mbit/s and CAN FD up to 5 Mbit/s, with selectable termination. The product page says the logger can take up to 512 CAN data channels and 512 flag channels, with templates for a range of aftermarket control units and for legislated CAN OBD, manufacturer mode 22, UDS, J1939 and NMEA 2000. A template list is not a promise that a particular calibration variable exists on a particular ECU. It does mean the serial log and the pressure diagram can be the same file.
Storage is 1 GB internal, described as expandable. The product-page table states an option up to 32 GB. The March 2025 datasheet says expandable and does not state the 32 GB option. Sixteen channels at 200 kHz accumulate samples far faster than a 100 Hz CAN log, so a long mapping session is the Ethernet stream to a computer, and the internal memory is the record when the car is out of cable range. Plex also lists a live stream and a fast download of that memory as the purpose of the Ethernet port.
Pressure sensors Plex expects
The datasheet says the logger accepts piezoelectric and optical pressure sensors, including sensors built into a spark plug, and intake and exhaust pressure sensors. AVL and Kistler sensors need external amplifiers. Plex states that it resells Optrand and Kulite sensors, and that AVL and Kistler sensors are bought from those makers.
Plex's description of the optical sensors follows the Optrand fibre-optic type. Pressure changes the light in the fibre. There is no charge to leak away down a dirty connector, and the fibre is immune to the electrical noise of an ignition system. Plex gives high temperature without water cooling as an advantage, with 400 °C as an example rather than as a limit for every probe. The probe's own sheet is the limit. Piezoelectric sensors are described in the same place as the AVL and Kistler pattern: high bandwidth, a charge output, and a compulsory charge amplifier. Plex notes the practical split in accuracy. A thermodynamic calculation wants the better sensor. Peak pressure and knock can be useful on a lesser one. That judgement still depends on the installation. A spark-plug sensor avoids a machined boss in the head, and Plex lists cost, durability and compatibility as the trade. A flush sensor in a purpose-machined bore is the arrangement Kistler describes for research work.
Intake and exhaust sensors on this class of system are often piezoresistive, Kulite being the name Plex resells, because those ports need an absolute or a gauge pressure that stays valid, including vacuum in the manifold and a fast pulse on top of it. A piezoelectric sensor that only follows change is a poor fit for a manifold pressure that sits at 1.5 bar for a whole pull. Assigning a high-speed channel to the intake runner, or to the exhaust primary, is the low-pressure indication Kistler describes. It is also the measurement behind the runner-length and exhaust-primary pages: the pulse is visible, rather than inferred from a torque curve alone.
What the software calculates each cycle
Plex PCA-WIN is the analysis program, with Device Manager as the configuration program. The datasheet lists the calculated set, and the product page defines the terms. They are per cycle and, where more than one cylinder is instrumented, per cylinder.
Peak pressure and its angle. Pmax is the highest pressure in the cycle. Pmax CA is the crank angle at which it occurs. dPmax is the greatest rate of pressure rise, and dPmax CA is where that slope is steepest. Peak pressure is a mechanical load on the piston, the head gasket, the bearings and the fasteners. The rate of rise is how suddenly that load arrives.
Burn angles and combustion duration. Mass fraction burned is the calculated share of the fuel energy released by a given crank angle. CA10, CA50 and CA90 are the angles of 10, 50 and 90 percent burned. CA50 is the midpoint of the burn and the figure Plex points at for ignition, injection and camshaft timing. Combustion duration is the crank-angle span from the start to the end of significant heat release. These are calculations from the pressure and the volume. They move when top dead centre is wrong, and the SAE finding cited above says they also move when pegging is wrong, even though peak-pressure location does not.
Heat release. The heat-release curve is plotted against crank angle, with the maximum and the angle of that maximum. It is derived from the pressure diagram and the changing volume. It is not a heat-flux sensor in the chamber.
Indicated mean effective pressure. Gross IMEP is taken from the compression and expansion strokes. Pumping IMEP is taken from the intake and exhaust strokes. Net IMEP is the work that remains for the piston after gas exchange. Plex describes the related indicated torque and power as the work of the cylinder pressure before friction and inertia. A dynamometer reading is shaft torque, after friction and after the oil pump, the water pump and the alternator. The two numbers are related and they are not interchangeable. The pumping term is where a restrictive exhaust, or a turbine, shows up as work the piston spends pushing gas out, and where a tuned intake shows up as work recovered during induction.
Volumetric efficiency. Plex defines it as the fill of the cylinder against the theoretical maximum, as a percentage. The software can only compute that from the engine size it was given and from the pressures and temperatures it was given. A wrong bore or stroke scales it. It is still the figure that says whether a longer runner, a different cam or a different compressor actually trapped more air.
Knock, pre-ignition and misfire. Knock intensity is the energy Plex calculates in the pressure oscillations. Knock max pressure is the highest positive peak of those oscillations. Pre-ignition is an early burn identified from the pressure, and a misfire is a cycle with no combustion pressure rise. These are three different events. Knock is a ringing burn. Pre-ignition is a burn that started before it should have. A misfire is a burn that did not happen. An ECU knock-retard channel on the serial log is the controller's reaction, often from a block-mounted accelerometer. It can move because the sensor is loose, because the threshold is tight, or because the chamber really rang. The pressure oscillation settles which of those it was.
The displays match the way the numbers are used. A signal-scope view is the raw sensor and trigger voltage, for proving the wiring and the crank pattern before any angle is trusted. A cycle graph plots a channel against crank angle. A pressure-volume graph plots it against cylinder volume, on a linear or a logarithmic axis. The area of that pressure-volume loop is the indicated work. Overlaying many cycles, and averaging them, separates a stable combustion from a lucky single cycle. A statistical view shows minimum, maximum and the scatter of a chosen figure. A binned view groups the cycles into engine-speed bands for a dyno ramp or a track session, which is the form that can be read beside a fuel or ignition table. Plex describes smart tuning maps as cell graphs whose contents can be carried across to the calibration maps. Writing the map is still a change in the ECU's calibration tool, followed by another log.
The datasheet also lists file comparison with a live update, CSV import and export, and video synchronised to the log. Comparison is how a dyno ramp and a lap, or a before and an after, are read as the same kind of picture. Sixteen maths channels are listed. Lap time, acceleration and two trip meters are listed as calculated channels from the GNSS and inertial sensors.
A valvetrain rig is a separate test
An optional firmware and software module analyses valve motion from a SpinTron rig. Plex describes it as able to run with the combustion system or as a valvetrain-only system. The events it names are valve loft, valve toss and valve bounce, and the plots are lift, velocity and acceleration, plus spring harmonics. In camshaft testing, loft and toss are the valve leaving the path the cam was ground to give it, and bounce is the valve leaving the seat again after it has closed. A SpinTron test motors the valvetrain. It does not fire the cylinder. It answers a mechanical question the pressure diagram cannot answer: whether the valve is still following the cam at the speed where the combustion data were taken. A burn angle measured on an engine whose valves are floating is a measurement of a valvetrain failure, and the pressure trace alone will not say so.
Using the records together
A coherent preparation file has three layers, taken on the same run where that is possible.
The serial layer, from the ECU or from the CAN templates in a logger such as the Plex unit, holds the request and the result the controller knows about. Commanded spark against delivered spark, commanded boost against measured boost, lambda against injector time, and any limiter flag. On the Plex logger those channels share a clock with the pressure. On a separate serial tool they have to be aligned afterwards by engine speed and throttle, which is rougher, especially in a gear change.
The electrical layer is the oscilloscope or, in the older bay, the Crypton analyser. It is the proof that the spark, the injector current and the crank pattern exist. A perfect CA50 calculated from a pressure sensor is meaningless if the crank trigger into the analyser is not the same pattern the ECU is using, or if the ignition pickup shows the spark 10 degrees away from the angle the ECU claims to have delivered. The scope capture of that trigger, saved with the combustion file, is the reference.
The combustion layer is the pressure diagram. Per-cylinder peak pressure, CA50, net IMEP and knock intensity, over a repeatable ramp, are the design results. A cylinder that is late, or light on indicated work, or ringing, is then read on its own trace. Intake and exhaust pressure on further high-speed channels show whether that cylinder failed to fill, or spent the work pumping. Exhaust temperature on a type-K input shows a cylinder that is lean or late in a way the single manifold lambda averages out. The barometer and the ambient temperature go in the header of the file so a record made on another day can be compared.
The order of trust runs from the installation upward. Connector and trigger first, on the raw scope view. Then pegging and top dead centre, because they move the burn angles. Then the operating point from the serial channels, because a combustion change at a different lambda or a different coolant temperature is not a test of the part that was changed. Then the cycle statistics, because one clean cycle can be found in a run that is unstable the rest of the time. The binned average is the last picture, and it is the one that can be set beside the calibration table.
Limits
A serial sample rate is the ECU's rate, not the sensor's bandwidth. A modelled load is not a manifold-pressure measurement. An oscilloscope buffer is finite, and a CAN decode inside it is not a day-long bus log. A Crypton parade shows the ignition of its era, and the later workstation adds a short stored scope and a code reader. Neither is cylinder pressure.
On a combustion system, the sensor, the passage, the charge amplifier, the cable, the crank reference and the engine dimensions are all part of the result. Plex's 200 kHz and its list of trigger wheels do not remove thermal shock or a top-dead-centre error. Indicated torque is not brake torque. Knock intensity from chamber pressure is not an ECU knock count. Volumetric efficiency and heat release are calculations. The 4, 8 and 16 channel counts, the current limits, and the supply-voltage figures are only as good as the Plex document they came from, and those documents currently disagree on the points named above. A figure from a sensor or amplifier manual overrides a range printed for the logger input.
Sources
K-line communication description. OBD Clearinghouse. Five-baud initialisation, the two-second address and the move to 10.4 kbit/s. Accessed 2026-11-11.
ISO 9141-2 physical-layer extract. Bidirectional K-line, 10.4 kbit/s, byte format, and OBD messages of 5 to 11 bytes. Accessed 2026-11-11.
ConnectDetect. Pico Technology. ×1 leads and the 100 kΩ circuit limit. Accessed 2026-11-11.
Serial decoding. Pico Technology. CAN, CAN FD, FlexRay, LIN and SENT. Accessed 2026-11-11.
CAN bus: who's online, and who said what. Pico Technology. Sample rate, frame counts, and the difference between a scope capture and a CAN logger. Accessed 2026-11-11.
History of Crypton. Crypton / VDO. Company timeline through 2025. Accessed 2026-11-11.
Crypton Equipment. Grace's Guide. Secondary summary, including the 1936 tester and 1950s oscilloscope claims. Accessed 2026-11-11.
Analysing engine performance. Commercial Motor, 25 October 1957. Crypton B.70 Master Motor Analyser and EIX.35 compression tester. Accessed 2026-11-11.