

The Risks of Mobile Tuners
Understanding a Turbo Compressor Map and Its Role in Tuning
A compressor map is essential for selecting and tuning a turbocharger effectively. It helps optimize performance while maintaining reliability.
1. The Axes of the Compressor Map
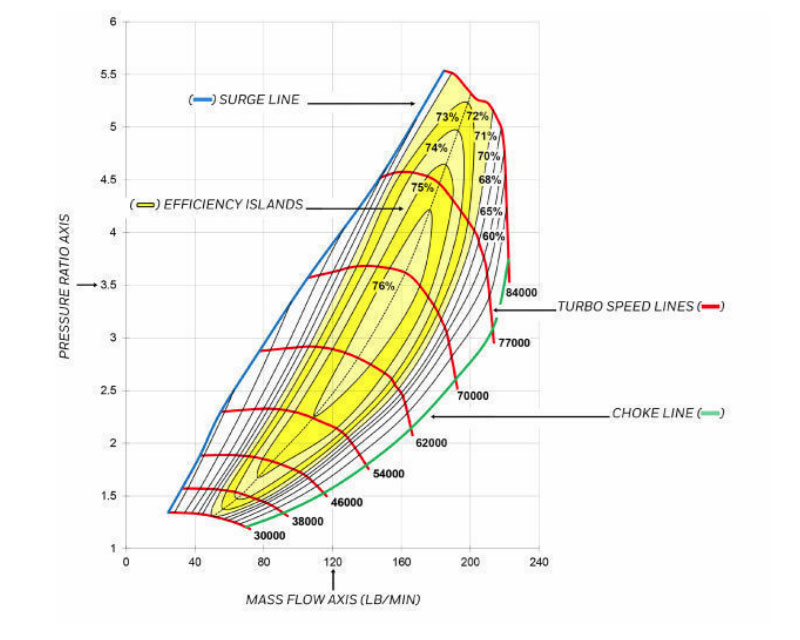
X-Axis: Mass Flow Rate (LB/MIN)
- Represents air mass moved per minute.
- More airflow = More power potential.
- Estimated using HP: 9.5–10.5 HP per lb/min.
Y-Axis: Pressure Ratio
- Ratio of compressed air pressure to inlet air pressure.
- Higher ratio = More boost, but also more heat.
- Formula:
Pressure Ratio = (Boost Pressure + Atmospheric Pressure) / Intake Pressure
2. Key Features of the Compressor Map
Surge Line (Blue Line)
- Indicates the minimum airflow limit.
- Surge can cause compressor flutter and instability.
- Avoid by using proper boost control and wastegate tuning.
Choke Line (Green Line)
- Indicates the maximum airflow limit.
- Going beyond this results in low efficiency and overheating.
- If choking occurs, a larger turbo may be needed.
Turbo Speed Lines (Red Lines)
- Show constant turbo shaft speeds (RPM).
- Higher speeds = Higher pressure and airflow.
- Exceeding speed limits leads to bearing wear and failure.
Efficiency Islands (Yellow Regions)
- Represent zones of optimal efficiency.
- Running in these zones improves power and reduces heat.
- Lower efficiency leads to higher intake temperatures.
3. The Role of the Compressor Map in Tuning
Many tuners with less OE experience install bigger turbos but remove proper boost control. This approach works to a point but isn't optimal.
- A compressor map helps adjust fuel, timing, and boost for maximum efficiency.
- It ensures you stay within safe turbo speeds and avoid surge or choke.
- Proper electronic wastegate tuning prevents turbo overspeed.
4. How to Use a Compressor Map for Turbo Selection
Step 1: Determine Mass Flow Requirements
Use HP = Mass Flow Rate × 9.5-10.5 to estimate airflow.
Example: A 500 HP engine requires 47-53 lb/min of airflow.
Step 2: Calculate Pressure Ratio
Formula: Pressure Ratio = (Boost Pressure + Atmospheric Pressure) / Intake Pressure
Example: 20 psi boost at sea level → PR = 2.36
Conclusion: Tuning with a Compressor Map
Using a compressor map ensures that a turbo setup is optimized for:
- Better boost control and response.
- Avoiding surge, choke, and turbo overspeed.
- Maximizing power, efficiency, and reliability.
Instead of blindly increasing boost, tuners should use the compressor map to fine-tune fuel delivery, timing, and airflow management for the best results.

KLAUS NIELSEN
22.5K Followers
At the bleeding edge of tuning and ICE development
Motorsports & Fast Road Tuning Specialist
Software Skills: Reverse Engineering - Assembler(IDA Pro - OllyDbg - WinDbg etc)
C/C++ - Pascal - Java - C#/VB.Net - Python - Perl
Experience on PowerPC, x86/64, Motorola, Infineon TriCore etc